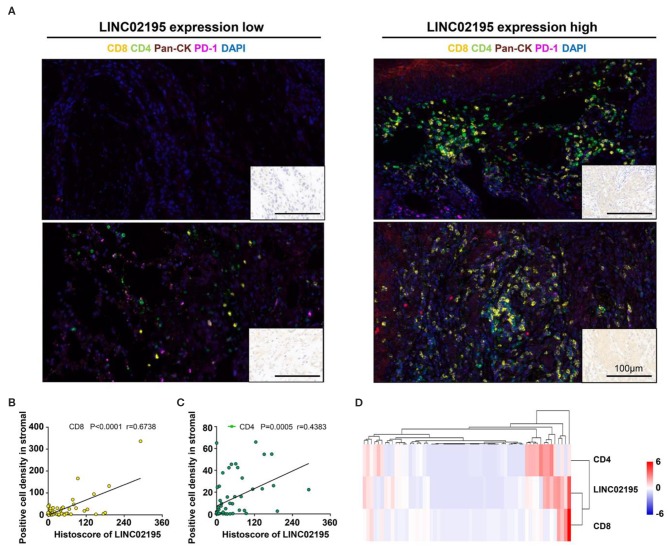
Figure 6.
LINC02195 expression was positively correlated with the infiltration of CD8+ and CD4+ T cells in the TME. (A) Representative image of multiplex staining (CD8, CD4, PD-1, pan-keratin, and DAPI) in human HNSCC specimens (low LINC02195 expression vs. high LINC02195 expression). Scale bar, 100 μm. (B,C) Pearson's correlation coefficient between the histoscore of LINC02195 and the number of CD8+ or CD4+ cells in the human HNSCC TMA. (D) Hierarchical clustering analysis of LINC02195, CD4, and CD8 expression in human HNSCC samples (n = 59).

