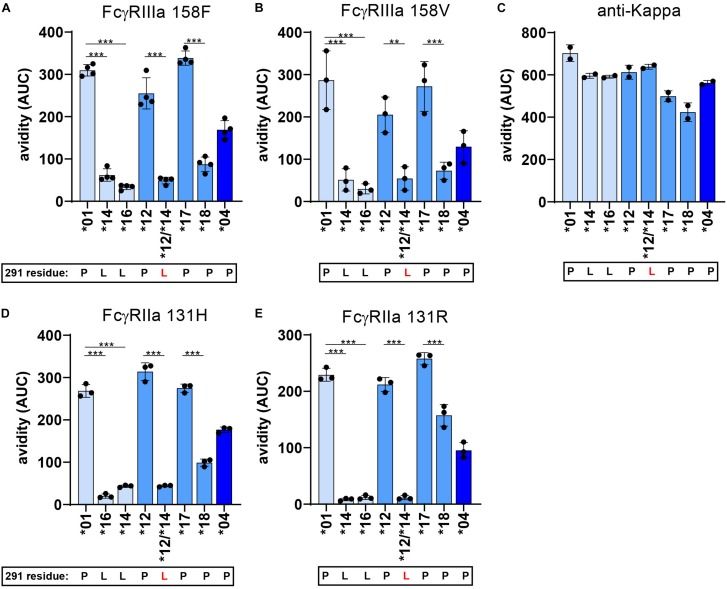
FIGURE 7.
FcγR avidity measurements of IgG3 allotypes. The avidity of RBCs opsonized with various IgG3 allotypes to FcγR as determined by cSPR. Avidity measurements to FcγRIIa 131R, FcγRIIa 131H, FcγRIIIa 158F, FcγRIIIa 158V were determined for seven IgG3 allotypes (*01, *04, *12, *14, *16, *17, *18) and one IgG3 mutant expressing a L291 (*12/*14). To compare between allotypes we calculated area under the curve (AUC) values from the Total/Sedimentation (T/S) ratios that are plotted in Supplementary Figure S6 at a specific receptor density and RBC opsonization concentration. Thus, avidity measurements to (A) FcγRIIa 131R at a receptor density of 30 nM and opsonization concentration of 0.625 μg/ml, (B) FcγRIIa 131H at a receptor density of 30 nM and opsonization concentration of 2.5 μg/ml, (C) FcγRIIIa 158F at a receptor density of 30 nM and opsonization concentration of 0.625 μg/ml and (D) FcγRIIIa 158V at a receptor density of 10 nM and opsonization concentration of 1.25 μg/ml. (E) Binding strength to an anti-kappa nanobody (density of 1 nM and opsonization concentration of 0.625 μg/ml) was determined simultaneously to confirm equal RBC opsonization levels with each allotype. Error bars indicate SD of ≥2 independent measurements. In all graphs the amino acid at residue 291 (single-letter code) for each antibody is indicated at the x-axis below the IgG3 allotype number, where 291-mutated antibodies are displayed with a red letter. Statistical comparison between antibodies were performed using a one way ANOVA analysis with Sidak’s multiple comparisons test (*p < 0.05, **p < 0.01, ***p < 0.001).

