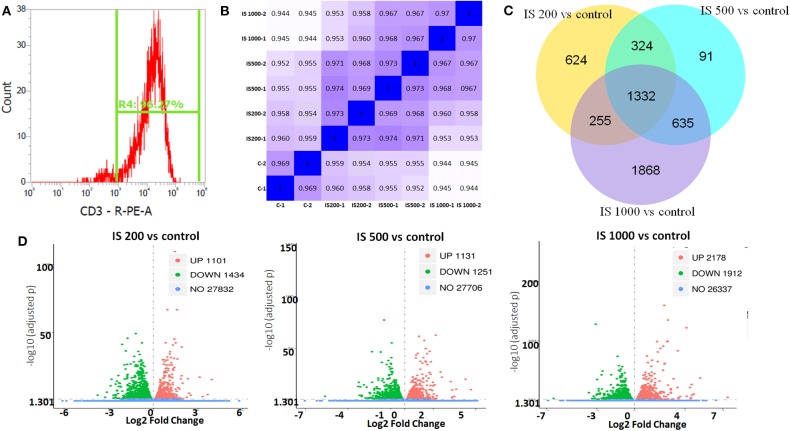
Figure 1.
T cell purity and global patterns of RNA-seq profiling. (A) The purity of T cells confirmed by flow cytometry; (B) Hierarchical clustering based on Pearson correlation coefficients among samples in IS groups; (C) Volcano plot showed the numbers of up and down regulated DEGs in each IS groups compared to the control group; (D) Veen figure showed the common and different DEGs in each IS groups.

