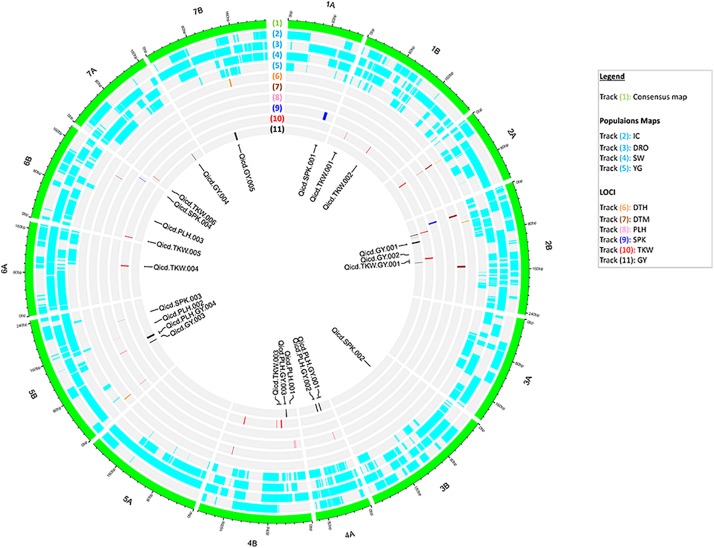
FIGURE 2.
Circos representation of the consensus map with aligned the marker density within each population, and the identified QTL for all traits. From outer to inner layer: (1) the consensus map with 14 chromosomes of durum wheat; (2–5) the genetic maps of the four populations: IC, DRO, SW and YG; (6–11) distribution of significant markers identified via QTL analysis for DTH, DTM, PLH, SPK, TKW, and GY. In the center, labels for QTLs of PLH, SPK, TKW, and GY independent from flowering time.

