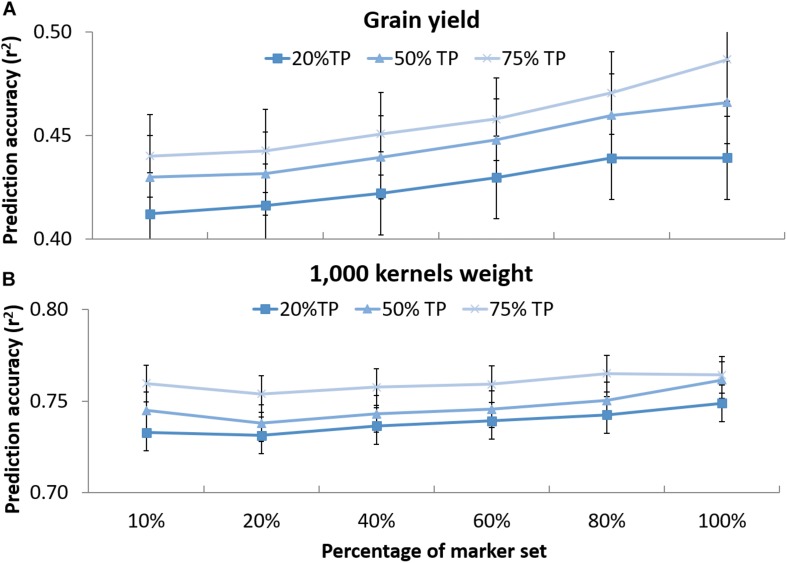
FIGURE 4.
Prediction accuracy for grain yield (A) and 1,000 kernel weight (B) using different randomly selected sub-sets of markers in decreasing order: 320 (10%), 640 (20%), 1,281 (40%), 921 (60%), 2,562 (80%), and 3,202 (100%) tested on DRO population using 20, 50, and 75% of the whole population as training set (TP) to predict the rest of the population (VP). The whiskers represent the standard errors.

