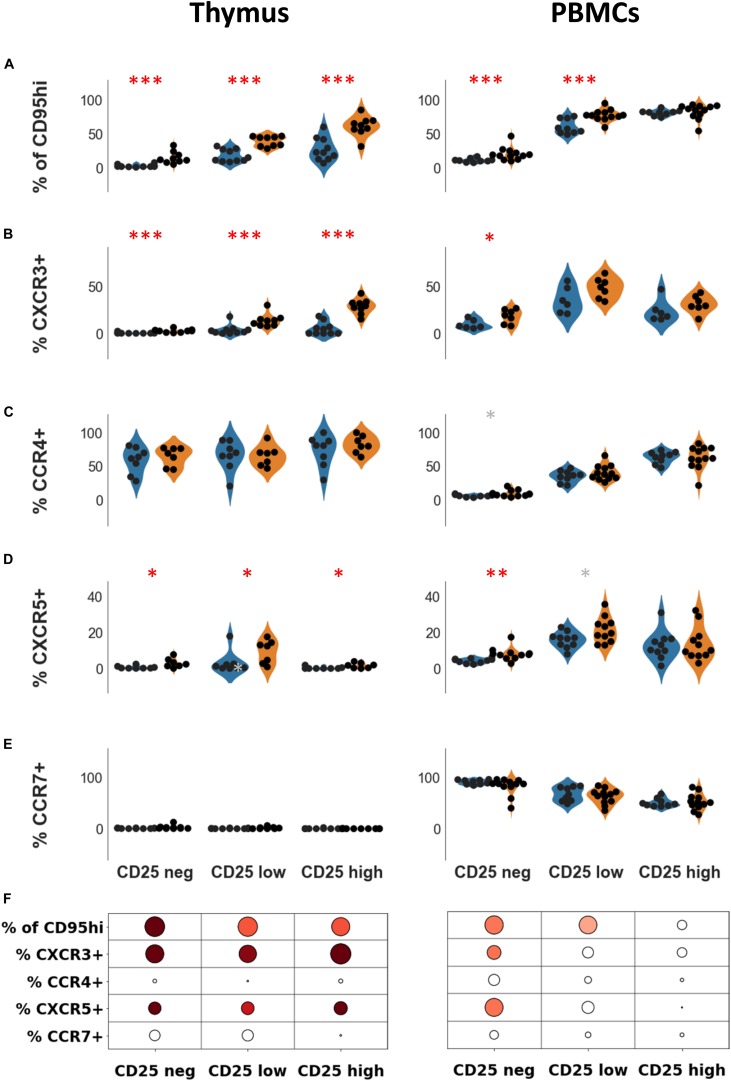
FIGURE 3.
Expression of CD95 and chemokine receptors in Treg subsets. Percentages of CD95hi (A) CXCR3 (B), CCR4 (C), CXCR5 (D), and CCR7 (E) according to CD25 expression, in healthy individuals (blue) or in myasthenic patients (orange) in the thymus (left panel) or in PBMCs (right panel). Statistical test: two-tailed Mann-Whitney (∗p ≤ 0.05; ∗∗p ≤ 0.01; and ∗∗∗p ≤ 0.005, gray star corresponds to p < 0.1). (F) Statistical summary of the data shown in this figure. Colorized bubbles correspond to significant differences. Size is proportional to the statistical significance and color represents fold change between mean values of control individuals and MG patients (green, lower value in MG; red, higher value in MG).

