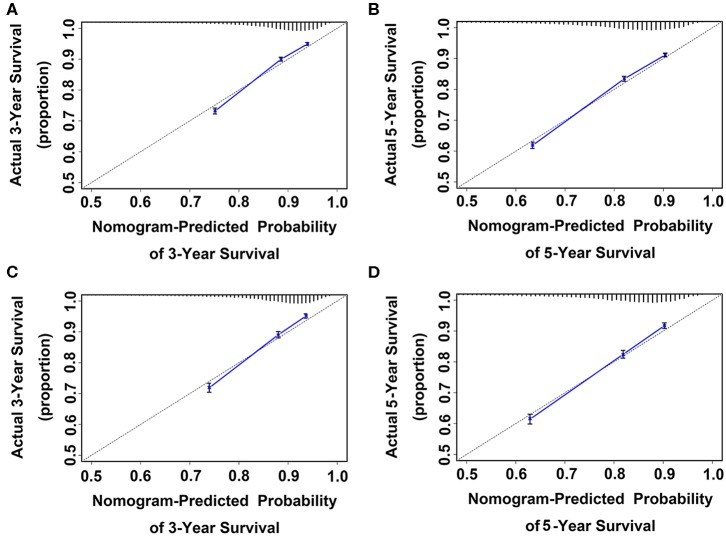
Figure 5.
Calibration curve for predicting patient survival at (A) three and (B) five years in the training cohort and at (C) three and (D) five years in the validation cohort. Nomogram-predicted probability of OS is plotted on the x-axis; actual OS is plotted on the y-axis. Shorter distance between two curves indicates higher accuracy.

