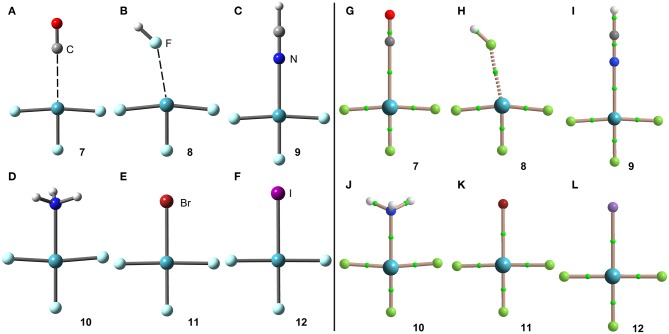
Figure 6.
Left panel: PBE1PBE-D3/def2-TZVP Optimized geometries of complexes 7 (A), 8 (B), 9 (C), 10 (D), 11 (E) and 12 (F). Distances in Table 1. Right panel: QTAIM distribution of bond critical points (green spheres) and bond paths for complexes 7 (G), 8 (H), 9 (I), 10 (J), 11 (K), and 12 (L) at the PBE1PBE-D3/def2-TZVP level of theory.

