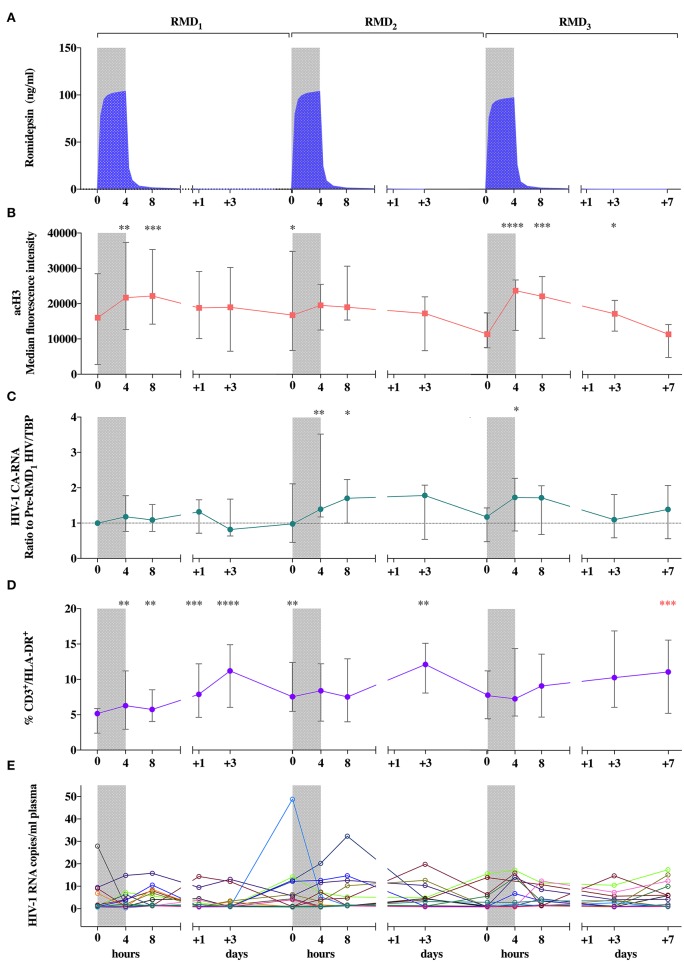
Figure 2.
Pharmacokinetic and pharmacodynamic effects of RMD. (A) Mean individual predictions of RMD plasma concentrations. (B) Levels of histone H3 acetylation in peripheral lymphocytes. (C) Viral transcription levels expressed as changes from pre-RMD1 levels of cell-associated HIV-1 RNA in peripheral CD4+ T-cells. (D) Levels of T-cell activation (CD3+/HLA-DR+ cells). (E) individual determinations of pVL. Median of frequencies and IQR (error bars) are represented. Wilcoxon signed-rank p-values compare each represented time point with the corresponding values preceding each RMD administration. *p < 0.05. **p < 0.01. ***p < 0.001 and ****p < 0.0001. The p value resulting from the comparison between the value at day 0 of RMD1 and 7 days after RMD3 is shown in red.

