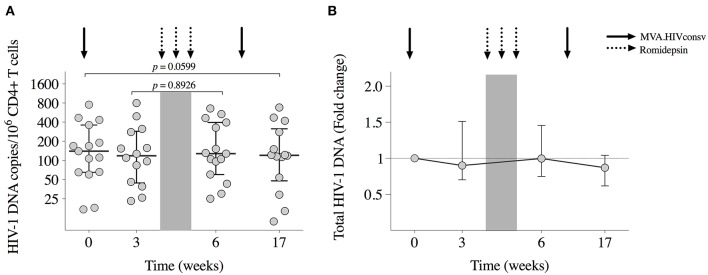
Figure 4.
Viral reservoir. (A) Total HIV-1 DNA copies/106 CD4+ T cells for each participant are shown at study entry (week 0), week 3 (day of RMD1), and week 6 (1 week after RMD3) and at week 17 (8 weeks after MVA2). Horizontal and error bars represent median and IQR, respectively, and p-values correspond to comparisons between the indicated time points using the Wilcoxon signed-rank test. (B) Changes in proviral DNA throughout the study with respect to baseline (week 0), which is considered to be 1.

