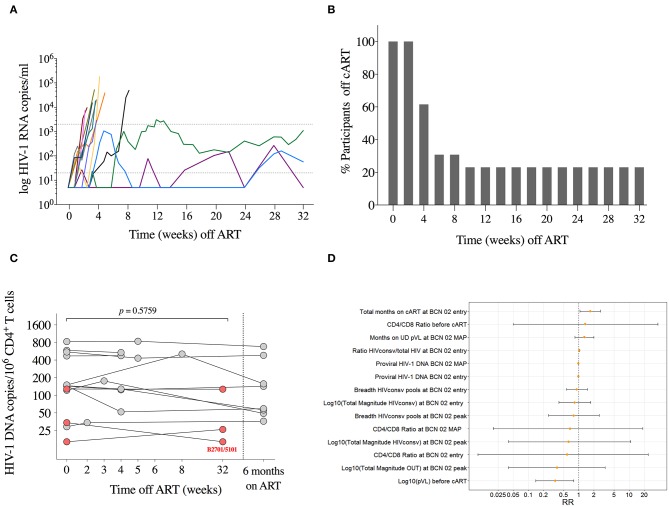
Figure 5.
Monitored antiretroviral pause. (A) Individual pVL during MAP is shown for each participant in different colors (n = 13). Lines are interrupted on day of ART resumption. Dotted lines represent detection limit and threshold for ART resumption (20 and 2,000 copies/ml, respectively). (B) Proportion of individuals remaining off ART during MAP. (C) Total HIV-1 DNA copies/106 CD4+ T cells are shown for each participant at MAP initiation, at day of ART ressumption, and 24 weeks after ART. P-value corresponds to comparison between MAP initiation and the day of ART resumption for each individual using the Wilcoxon signed-rank test. Individuals with sustained low-level viremia over 32 weeks are shown in red. (D) Estimated relative risks and 95% confidence intervals for the durable control of pVL during MAP obtained from univariate log-binomial regression models.

