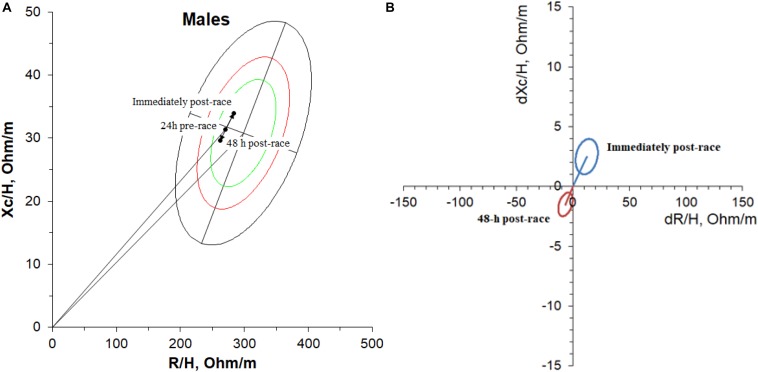
FIGURE 3.
Mean bioimpedance vectors (A) 24 h pre-race, immediately post-race, and 48 h post-race on RXc-graph and paired graph (B) for 19 non-elite marathon runners. The paired graph shows the 95% confidence ellipse corresponding to the mean bioimpedance vector difference obtained immediately post-race and 48 h post-race compared to baseline (24 h pre-race).

