
Fig. 42.
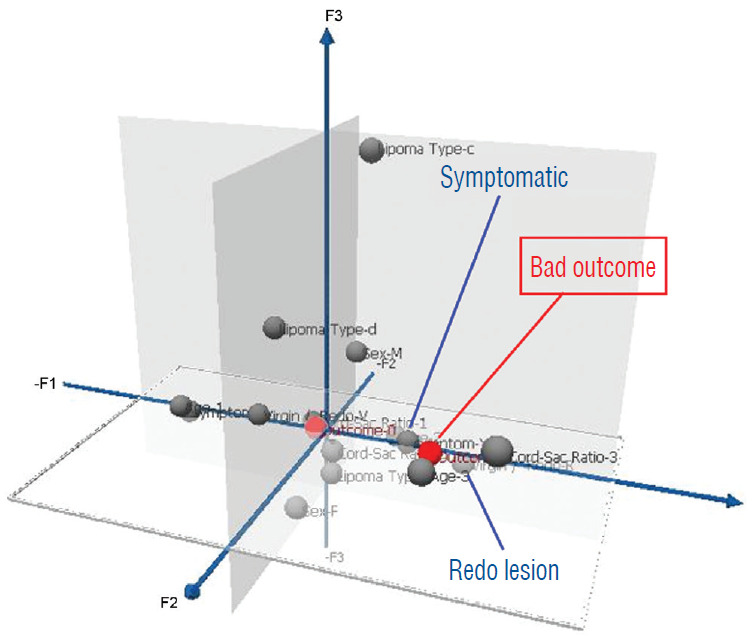
Pre-operative profiling of good versus poor risk patients for total resection using three dimensional Multiple Correspondence Analysis plot, which displays the respective strength of influence of the six predictor variables (gender, age, lipoma type, symptoms, redo versus virgin lipomas, and cord-sac ratio) on outcome after total resection. The grey balls represent predictor variables and red balls represent outcomes. Only the statistically significant predictors are flagged. Bad outcome implies recurrence and good outcome the absence of recurrence during the follow-up period. Close clustering of variables (with flags) around an Outcome signifies strong influence; remote scattering of variables (without flags) from an outcome signifies weak influence. Bad outcome is associated with pre-operative symptoms and redo lesions. Reprinted from Pang et al. [61] with permission from Springer Nature.