Figure 1.

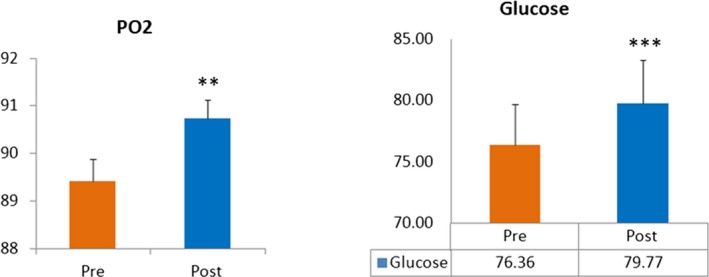
Comparison of PO2 and glucose levels pre‐ and post‐AOL advance meditation (n = 46). All results expressed as mean ± SEM. Data are statistically analyzed using SPSS 16.0 by the paired T‐test. *p < .05, **p < .01, ***p < .001

Comparison of PO2 and glucose levels pre‐ and post‐AOL advance meditation (n = 46). All results expressed as mean ± SEM. Data are statistically analyzed using SPSS 16.0 by the paired T‐test. *p < .05, **p < .01, ***p < .001