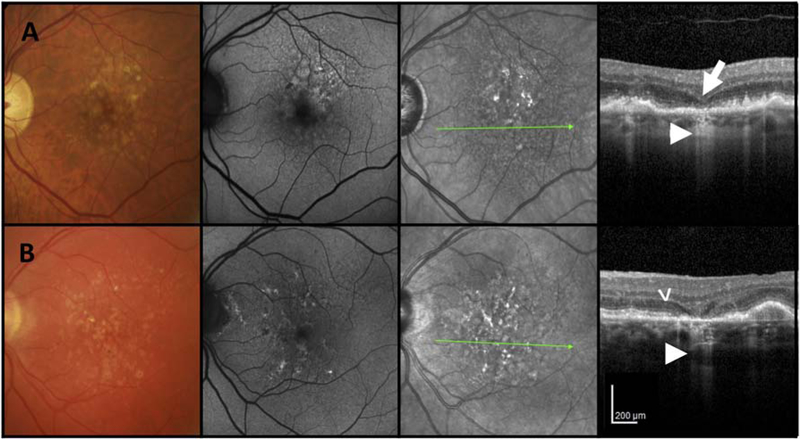
Figure 1. Examples of multimodal imaging features of incomplete retinal pigment epithelium and outer retinal atrophy (iRORA).
First column = color fundus photograph (CFP), second column = fundus autofluorescence (FAF), third column = near infrared reflectance (NIR), fourth column = optical coherence tomography (OCT) B-scan. A and B) CFP of the left maculae of two individual cases with large drusen. First column: CFP shows drusen and pigmentary changes without evidence of GA. Second column: FAF shows only small areas of hypo autofluorescence. Third column: NIR image illustrates no evidence of atrophy. Fourth column: OCT B-scan shows subsidence of the inner nuclear layer (INL) (large arrow) and outer plexiform layer (OPL). Note the hyporeflective wedge-shaped band within the limits of the Henle fibre layer (B) (arrow head). Note loss of photoreceptors as evidenced by outer nuclear layer (ONL) thinning and loss of external limiting membrane (ELM), ellipsoid zone (EZ) and interdigitation zone (IZ). Subjacent to the area of photoreceptor loss is a zone of attenuation and disruption of the RPE (<250 μm). A region of signal hypertransmission into the choroid is < 250 μm in continuity (small arrow). This fulfils the criteria for iRORA.

