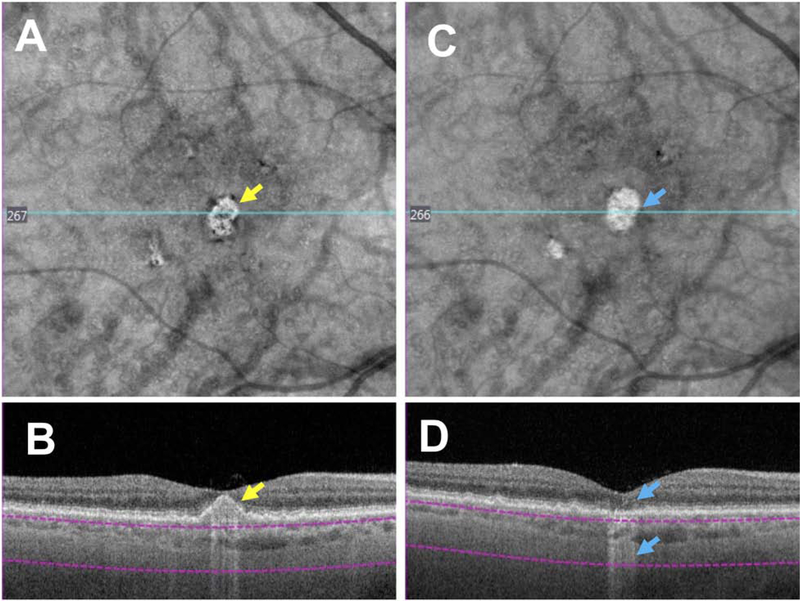
Figure 10. Screening for iRORA using an en face slab with boundaries beneath the retinal pigment epithelium (RPE) to detect hypertransmission into the choroid using swept source (SS) OCT imaging.
6×6 mm SS OCTA images of a right eye with large drusen. Panels A and B depict the eye at baseline and panels C and D show progression after 6 months. A: En face structure image using custom sub-RPE slab depicted by the purple boundary lines in B, and the bright area (yellow arrow) corresponds to the area of hypertransmission shown in B. B: SS-OCT B-scan showing a large druse with hypertransmission (yellow arrow). The boundary lines for the sub-RPE slab are shown beneath the RPE. There is loss of the photoreceptor-attributable bands, but the RPE remains intact, and as such, criteria for iRORA have not been met. C: Six months later, an en face structure image using the same custom sub-RPE slab depicted in panel A, but with a brighter area (blue arrow) corresponding to the area of hypertransmission shown in panel D. D: SS-OCT B-scan showing the collapse of the large druse with hypertransmission (lower blue arrow), disruption of the outer retinal layers (upper blue arrow) and a small disruption in the RPE can be seen. All criteria for iRORA have been reached.

