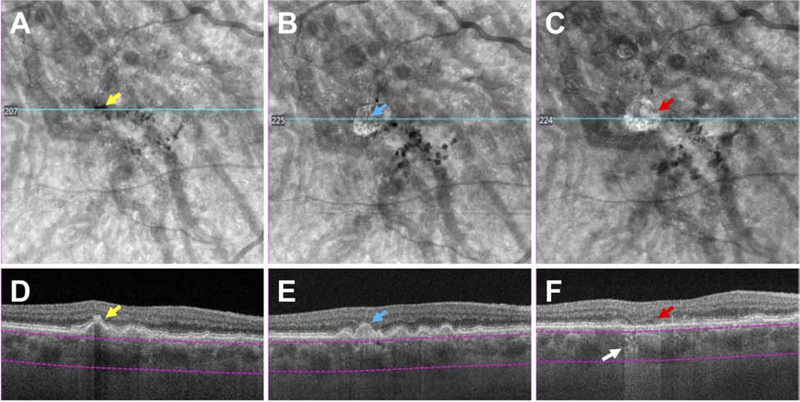
Figure 11: Screening for iRORA using an en face slab with boundaries beneath the retinal pigment epithelium to detect both hypo- and hypertransmission into the choroid using swept source (SS) OCT imaging.
6×6 mm SS OCTA images in an eye with large drusen. Figures A and D represent the baseline visit, B and E at the 12 months’ follow-up visit, and C and F at the 20 months’ follow-up visit, where iRORA is evident (red arrow). A: En face structural image using a custom slab (purple lines) showing a hyporeflective area (yellow arrow) corresponding to pigment migration (hyperreflective foci) over the druse in D (yellow arrow). B-F: En face structure images using a custom slab showing a hyperreflective area (blue arrow in B and red arrow in C), which respectively corresponds to drusen (E, blue arrow) with hypertransmission (white arrow) (F), subsidence of the INL and OPL, and a faint wedge-shaped band in the HFL (red arrow). In E, there is subtle hypertransmission into the choroid, subsidence of the INL and OPL and attenuation of the RPE, fulfilling all the criteria for iRORA, and again in F, iRORA is present, and the druse has regressed completely.

