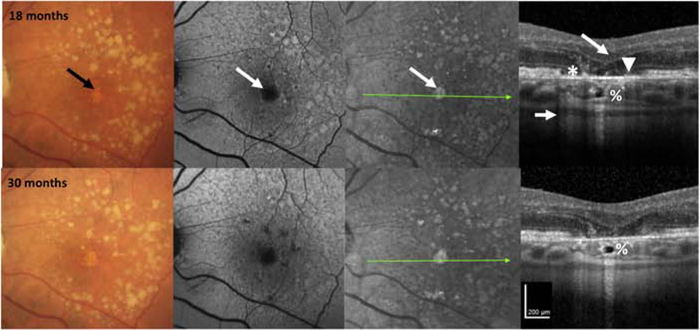
Figure 2. Multimodal imaging of an AMD case illustrating progression from incomplete to complete retinal pigment epithelium and outer retinal atrophy (iRORA and cRORA) over 30 months.
First column = color fundus photograph (CFP), second column = fundus autofluorescence (FAF), third column = near infrared reflectance (NIR), fourth column = optical coherence tomography (OCT) B-scan.
CFP of the left macula in a case with large drusen and hyperpigmentation, reticular pseudodrusen on FAF, and hyperreflective foci (#) on OCT at baseline. There is disruption of some outer retinal bands and the RPE, but no definite hypertransmission is present, so the criteria for iRORA are not met. At 6 months, there is hypertransmission into the choroid that is seen on OCT (small arrow), so iRORA criteria are now met. At 12 months, iRORA is more definitely seen on the OCT with RPE disruption < 250 μm wide (*), with remaining RPE cells difficult to distinguish from persistent basal laminar deposits (BLamD). There is subsidence of the inner nuclear layer (INL), outer plexiform (OPL), an external limiting membrane (ELM) descent on either side of the atrophy (large arrow), with corresponding hypertransmission (small arrow). There is no definite evidence of GA on CFP or atrophy on either FAF or NIR. At 18 months, the eye progresses to cRORA or GA on CFP (black arrow), and atrophy on FAF and NIR (white arrow). The OCT illustrates evidence of photoreceptor loss (subsidence of the INL and OPL, thinning of the ONL, discontinuous ELM descending on the sides of the atrophy, discontinuity of the ellipsoid zone (EZ) and interdigitation zone (IZ) (large arrow), an area of complete RPE disruption (without residual BLamD), > 250 μm (*) showing a bare Bruch’s membrane (BrM) (arrowhead) and increased hypertransmission > 250 μm (small arrow). At 30 months, the initial atrophic area has changed little compared to 18 months, but additional areas of atrophy are becoming apparent on FAF and NIR. The hyporeflective space in the choroid at 18 and 30 months has been described as a choroidal cavern (%).

