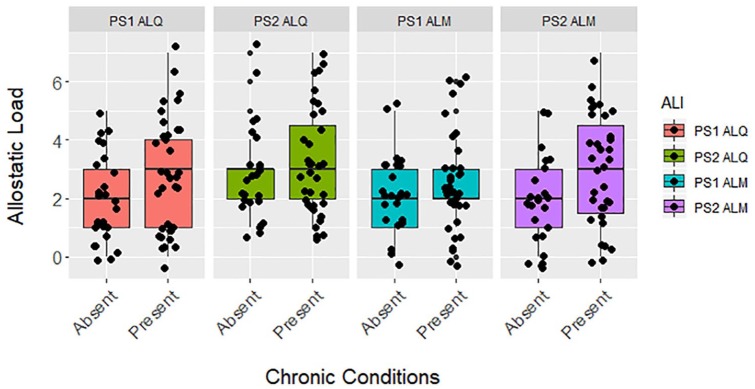
Figure 1.
Differences between allostatic load based on the presence or absence of chronic conditions in zoo-housed western lowland gorillas (n = 60) for PS1 ALQ (t test, t = −1.900, df = 58, P = .062), PS2 ALQ (t test, t = −0.801, df = 58, P = .427), PS1 ALM (t test, t = −1.105, df = 58, P = .274), and PS2 ALM (t test, t = −2.085, df = 58, P = .041). ALI indicates allostatic load index; ALM, multimethod approach, allostatic load estimated using primarily 1-tailed quartiles but also some 2-tailed split quartiles (top and bottom 12.5%), depending on the biomarker (eg, cortisol); ALQ, allostatic load estimated using traditional 1-tailed quartiles for each biomarker; PS1, pooled sample 1, allostatic load estimated at each zoo independently prior to pooling the sample; PS2, pooled sample 2, allostatic load estimated after pooling biomarkers from all locations.

