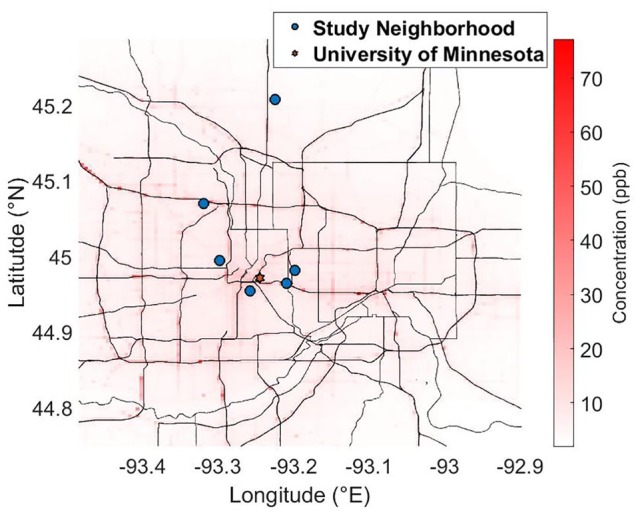
Figure 2.

Average on-road mobile-source NOx impacts simulated using R-Line for Minneapolis, MN, from October 2016 to April 2017. The blue dots indicate locations of neighborhoods where concurrent air quality measurements and emotional well-being (EWB) assessments were performed. The red star is the location of the University of Minnesota.
