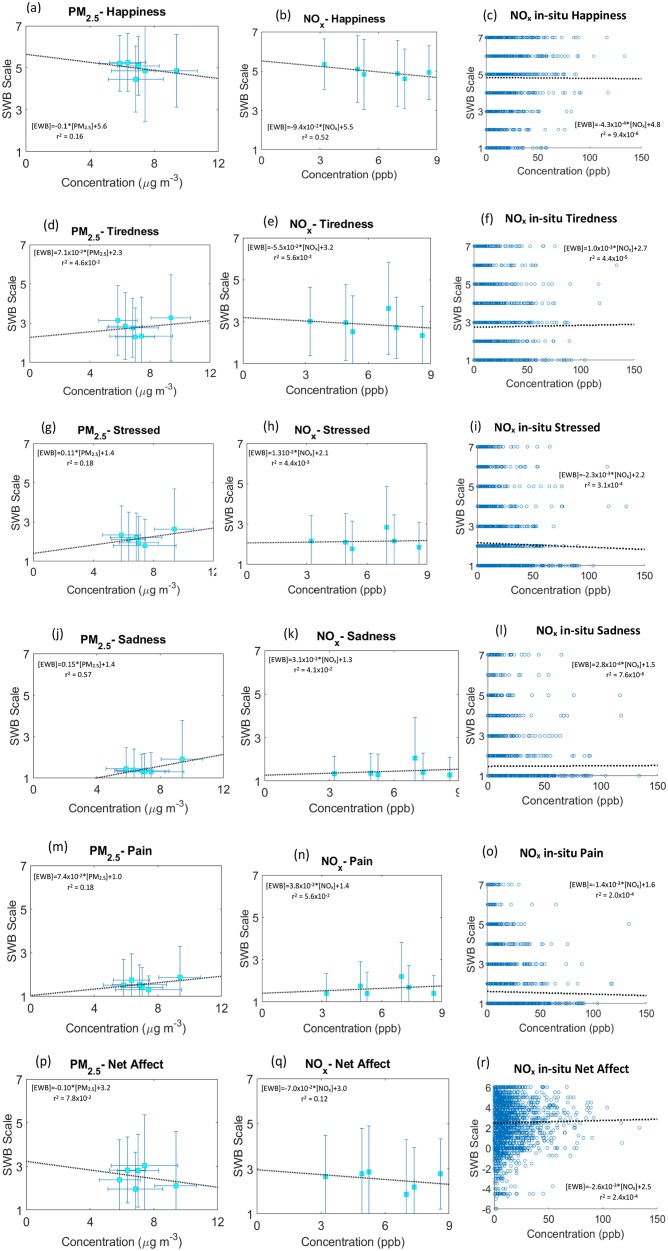
Figure 3.
(Left column) Average neighborhood low-cost sensor (LCS) PM2.5, (middle column) R-Line mobile-source NOx home-based exposure, and (right column) R-Line mobile-source NOx in situ exposure against concurrent emotional well-being (EWB) measurement (n = 5126) for (a-c) happiness, (d-f) tiredness, (g-i) stress, (j-l) sadness, (m-o) pain, and (p-r) net affect. A higher EWB score means “more” emotion (eg, a higher EWB happiness score means happier). None of the relationships were statistically significant (α = 0.05).

