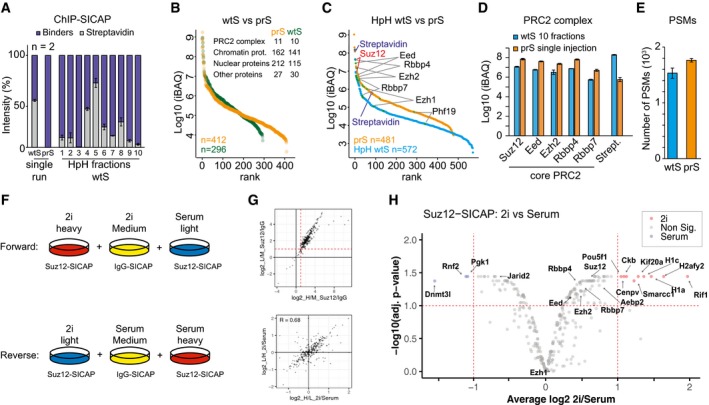
Relative intensity of streptavidin peptides from wtS and prS beads after single‐shot MS runs, or from wt beads upon high pH (HpH) fractionation and MS.
Intensity‐based ranking of proteins identified in single‐run MS analysis with either wtS (green) or prS beads (orange). For both experiments, number of identified proteins and their classification is shown.
Intensity‐based ranking of proteins identified after Suz12 ChIP‐SICAP using prS beads and single‐injection MS (orange) or using wtS beads followed by MS of HpH‐fractionated peptides (blue).
iBAQ values of the PRC2 core components after Suz12 ChIP‐SICAP, obtained with prS beads and single‐injection MS (orange), or with wtS beads and MS of HpH‐fractionated peptides.
Number of peptide‐spectrum matches (PSMs) in HpH wtS or single‐injection prS beads after Suz12 ChIP‐SICAP.
Experimental design for comparing the composition of PRC2 complex by Suz12 ChIP‐SICAP in mES cells grown in 2i and serum conditions.
Top: scatterplot showing the enrichment of proteins in ChIP‐SICAP using a Suz12 antibody compared to IgG as the negative control. > 2‐fold enrichment by two replicates was used as the threshold to remove the background. Bottom: scatterplot showing forward and reverse assays of Suz12 ChIP‐SICAP.
Volcano plot displaying proteins with differential association to Suz12 in 2i and serum conditions as determined using t‐test statistics. Fold change > 2 and Adj. P < 0.1 were used as the threshold.
Data information: Error bars in panels (A, D, and E) indicate standard deviation of two replicates.

