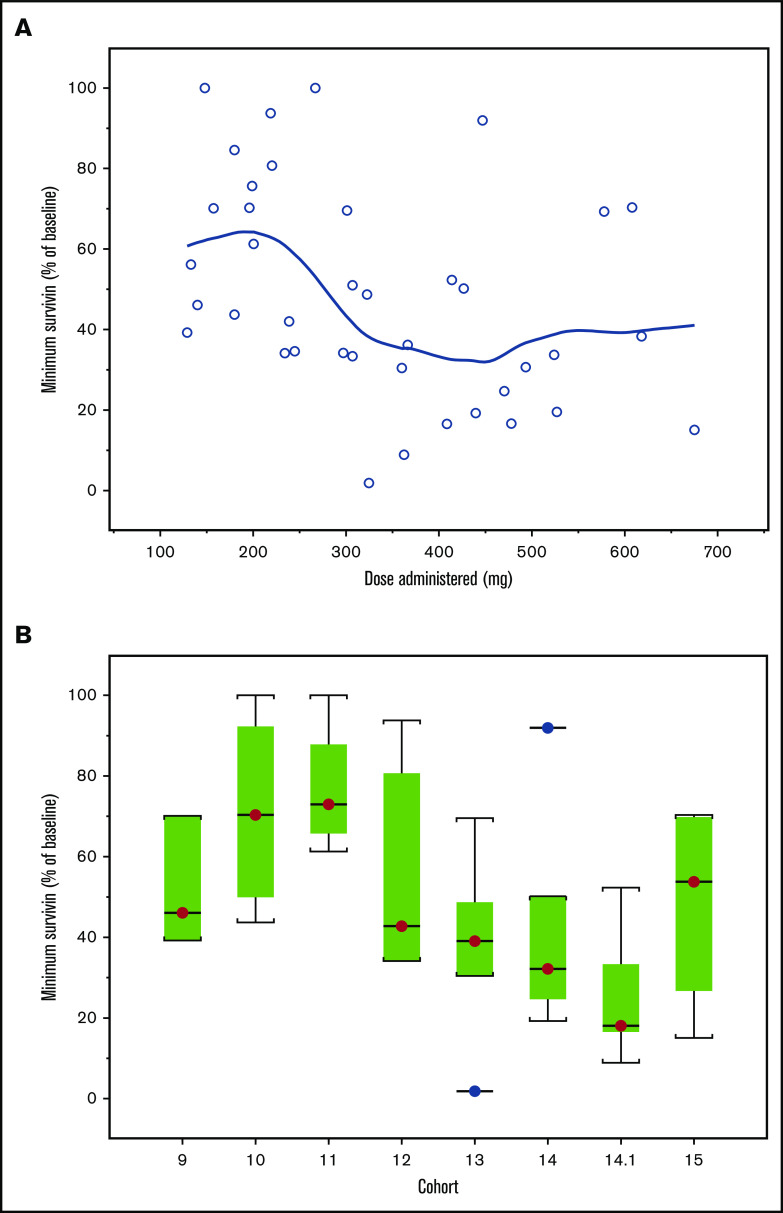
Figure 3.
Survivin profile. (A) Minimum survivin protein levels achieved (percentage of baseline levels) for dose administered and cohort. Note: A LOESS smoothing line is overlaid. (B) For the box-and-whisker plot, the line across each box, the top edge, and the bottom edge represent the median, the first quartile, and the third quartile, respectively. The horizontal lines connected with the whiskers extending from the box denote the minimum and the maximum values, respectively. Empty circles (○) indicate an outlier, defined as a value less than the first quartile minus 1.5 times interquartile range or a value greater than the third quartile plus 1.5 times interquartile range.

