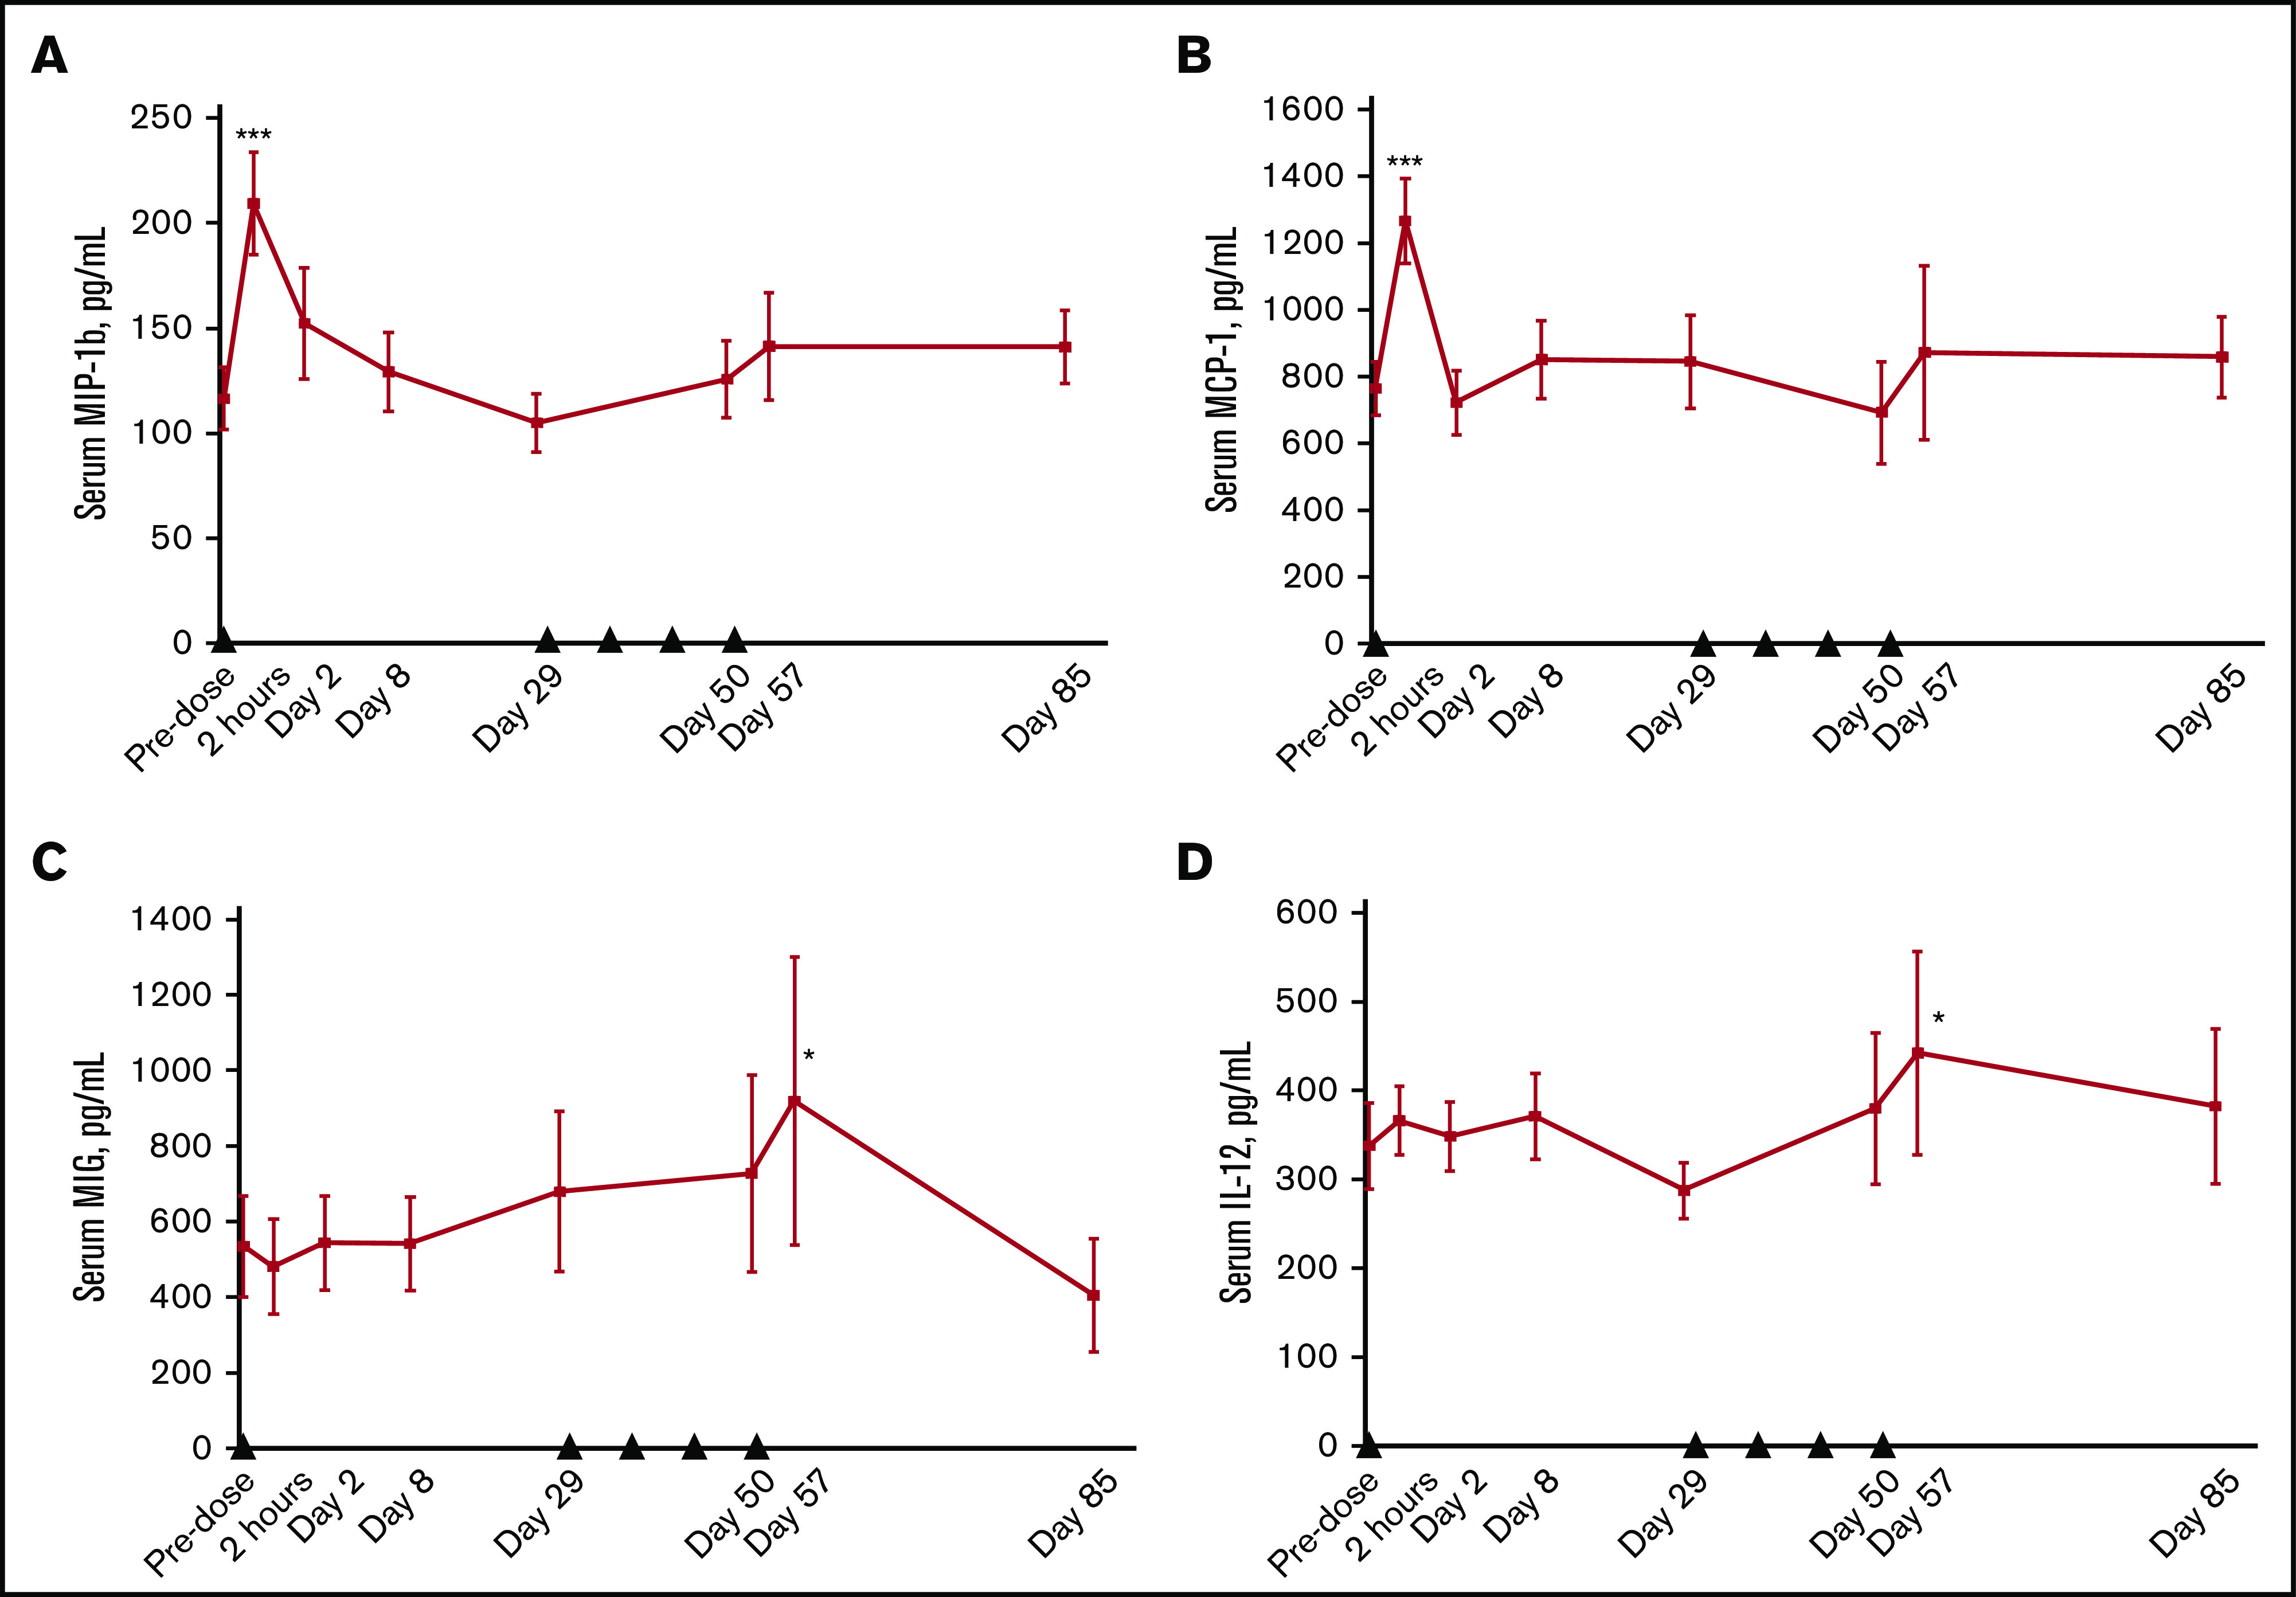
Figure 6.

Changes in serum levels of soluble factors after varlilumab administration. MIP-1β (A), monocyte chemoattractant protein-1 (MCP-1) (B), monokine induced by gamma interferon (MIG) (C), and IL-12 (D). Serum cytokines were measured by using the Luminex 200 System at the indicated times. Data represent the mean and standard error of patients across different dose levels (n = 9 to 11). Black triangles represent varlilumab dosing. Statistics are shown for paired Student t test vs baseline samples. *P < .05; ***P < .001.
