
Figure 1.
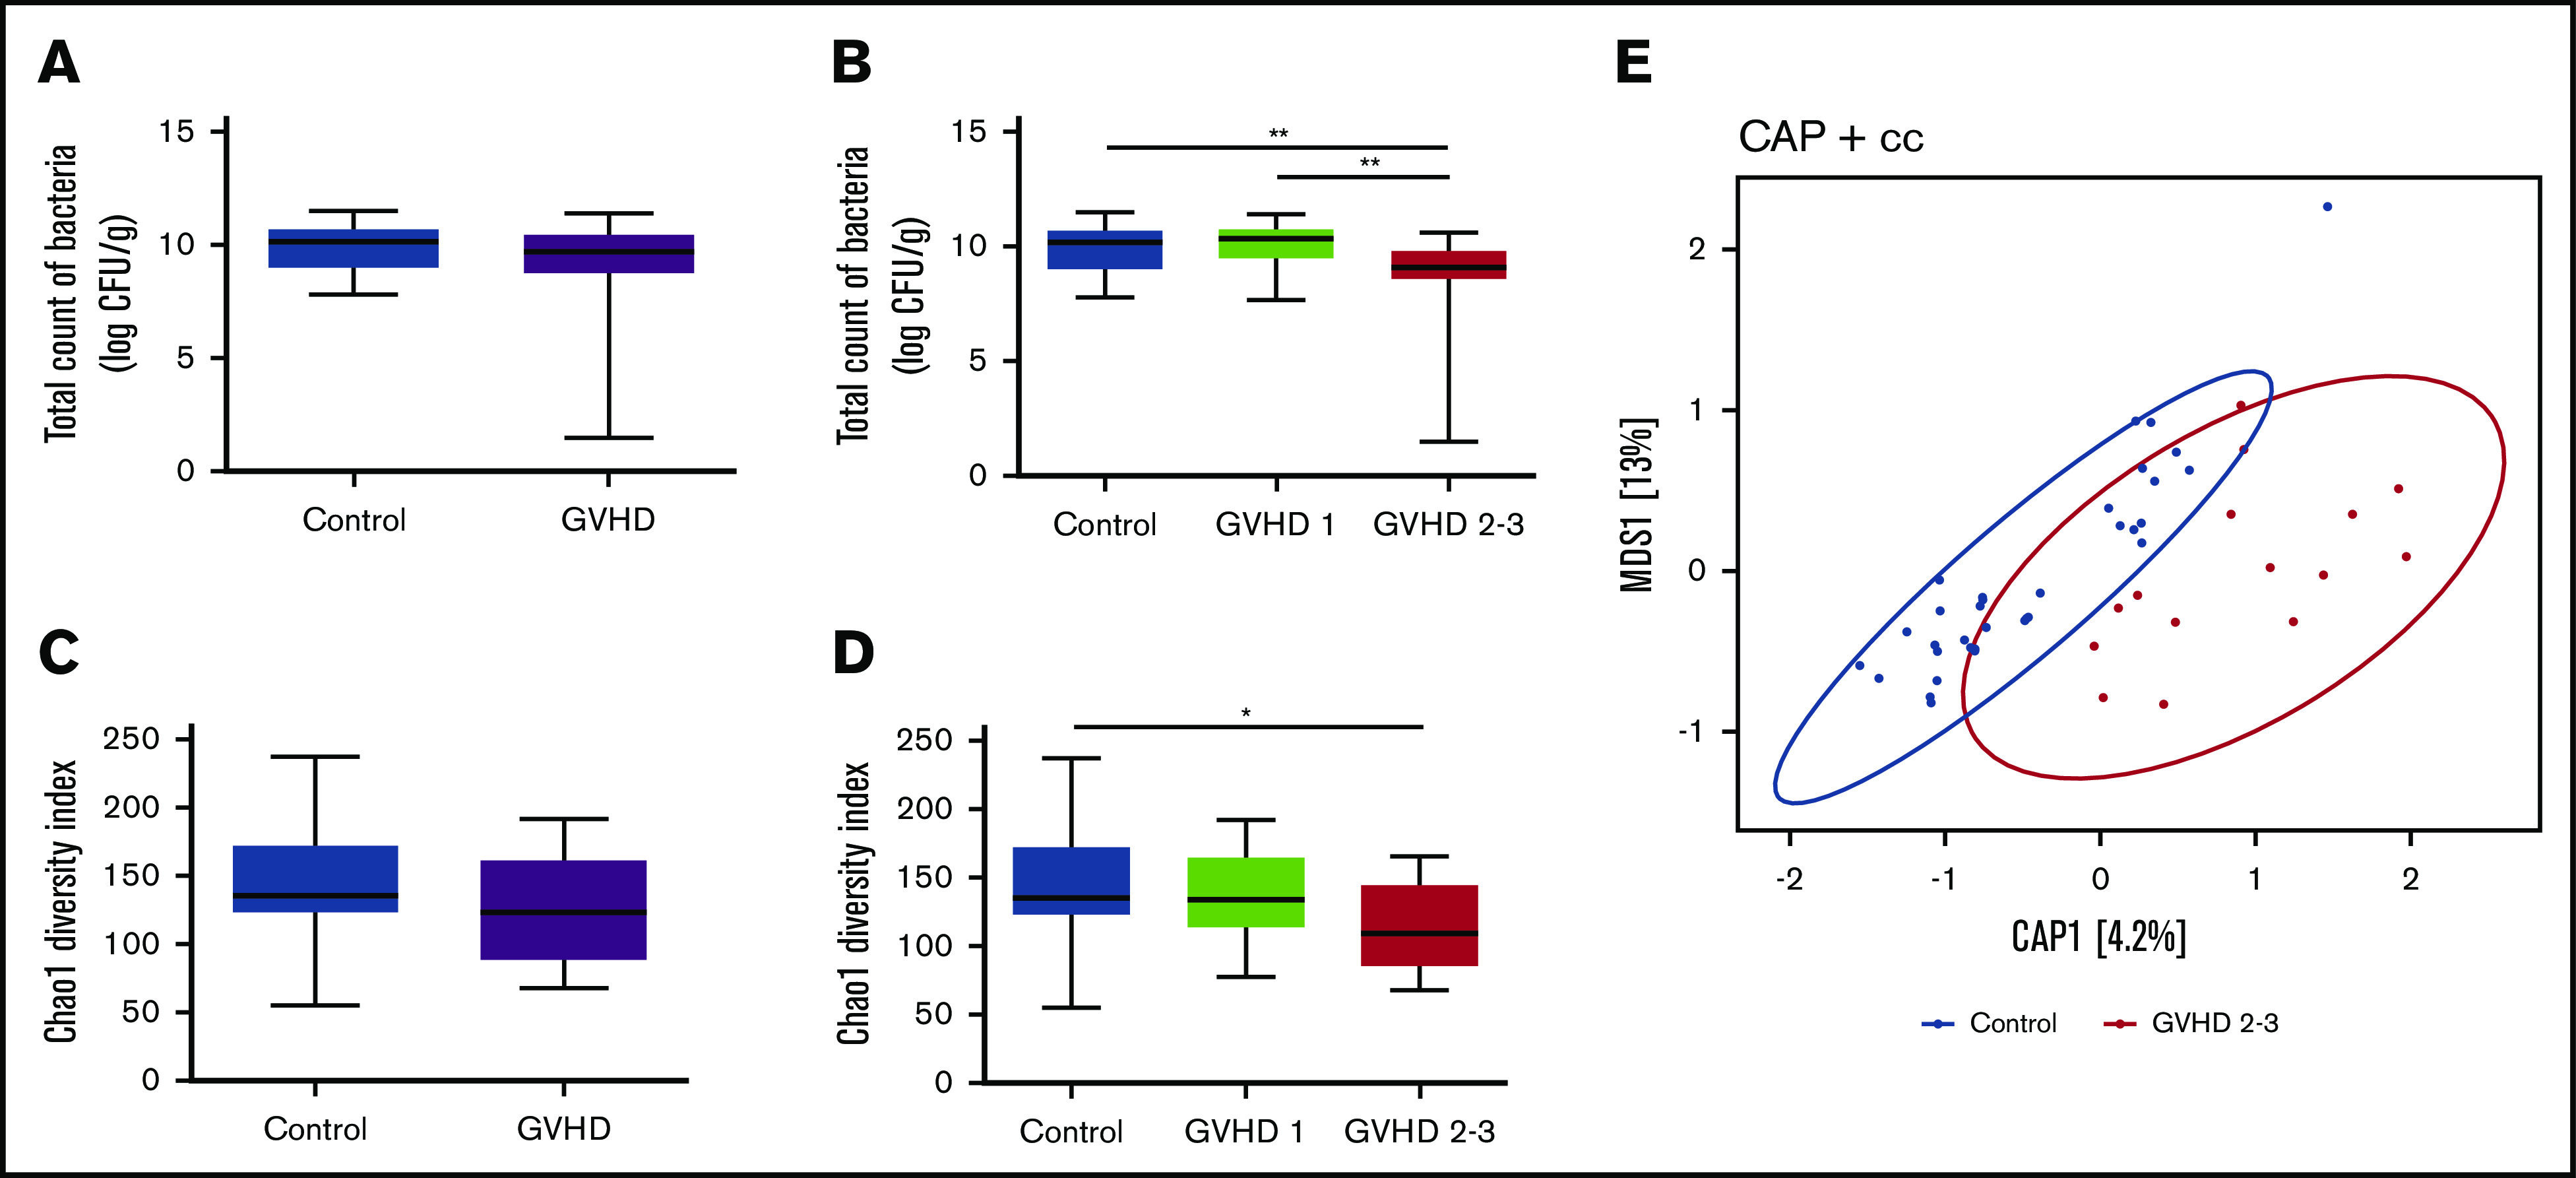
Microbial community profiles are distinct based on total bacterial load and diversity according to severity of gut aGVHD. Absolute abundance of the 16S rRNA gene in control and aGVHD patients (A) and abundance according to severity of gut aGVHD (control vs GVHD stage 2-3, P = .003; GVHD stage 1 vs stage 2-3, P = .004) (B). Bacterial α-diversity using the Chao1 diversity index in control and aGVHD patients (C) and α-diversity according to severity of gut aGVHD (control vs GVHD stage 2-3, P = .039) (D). (E) Constrained analysis of principal coordinates (CAP) plot of samples in control and severe aGVHD patients on the Jacard distance metrics (permutational multivariate analysis of variance [PERMANOVA] P = .008). Statistical analyses were performed using Wilcoxon-Mann-Whitney test with false discovery rate (FDR) correction for multiple testing and PERMANOVA. FDR *P < .05, **P < .01. cc, Jacard distance.