
Figure 2.
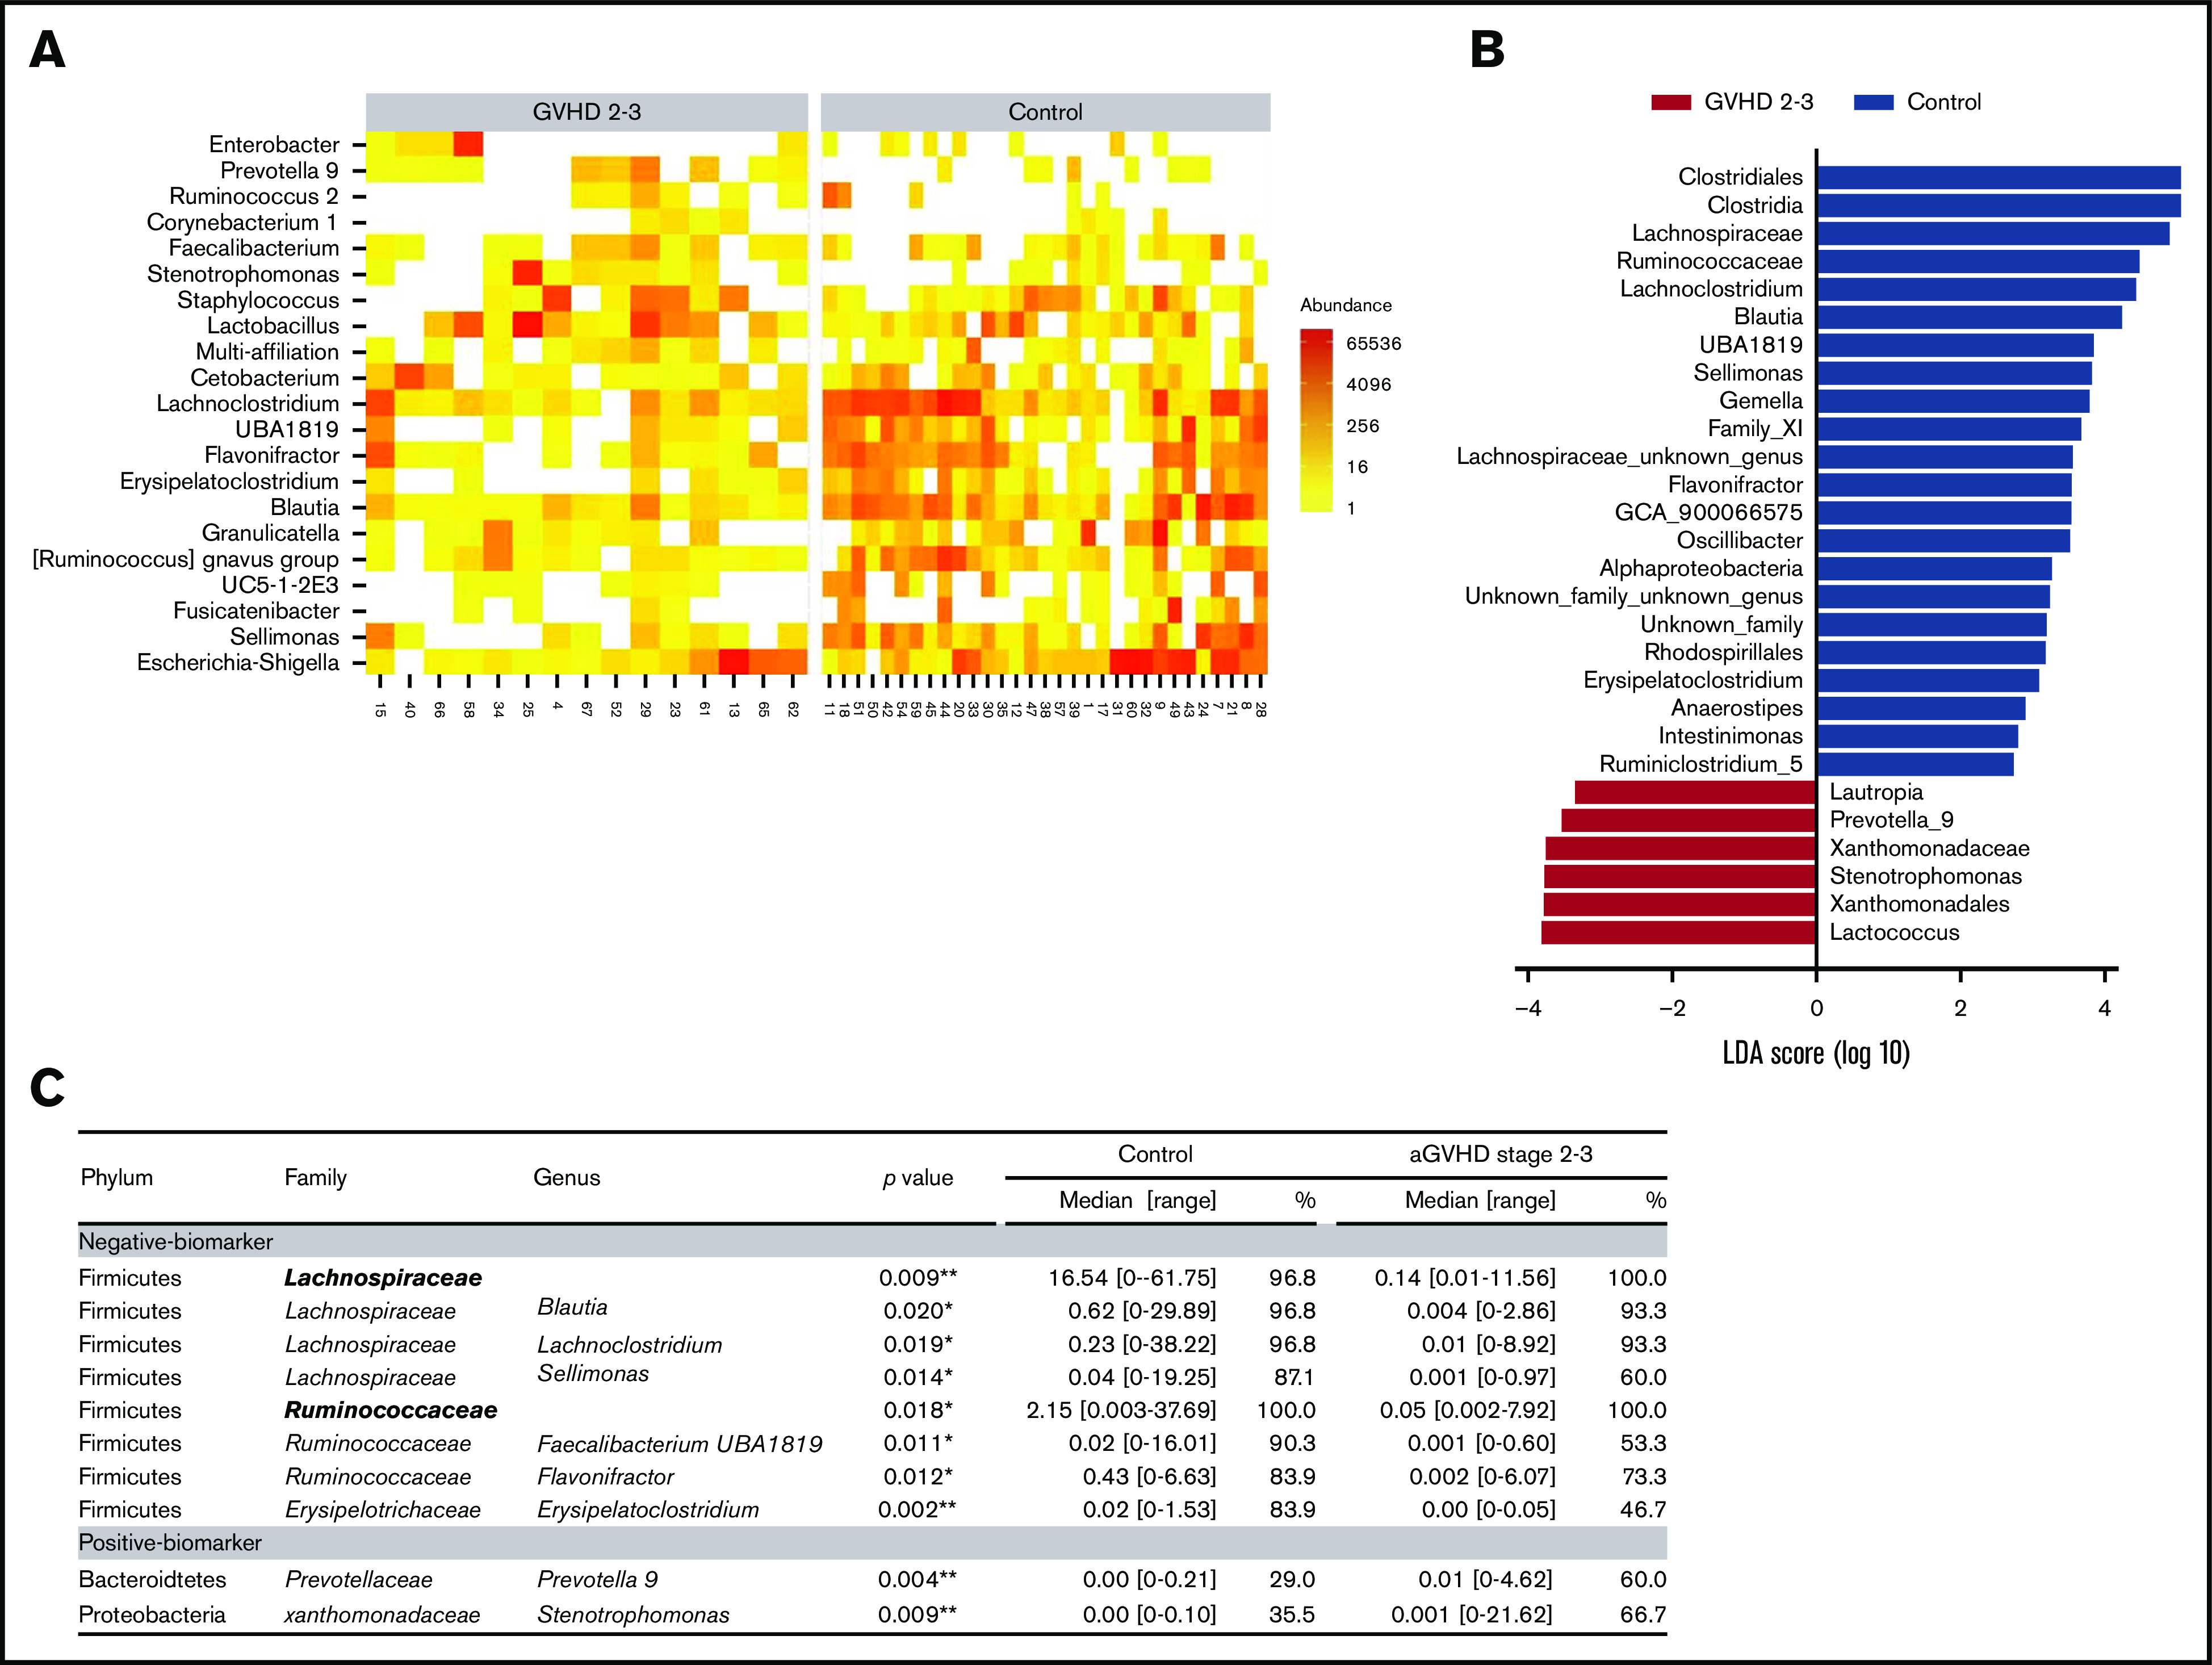
Microbiome signatures of severe aGVHD. To identify potential biomarkers of the microbiota characterizing patients with severe aGVHD (stage 2-3), several approaches were deployed. DESeq2 (A) and LDA effect size (LEfSe) (B) algorithms were used to identify bacterial taxa enriched in each group of patients. (C) In parallel, genera with a cumulative relative abundance in the cohort of at least 5% and present in >10 patients were selected, and relative abundance was compared between controls and severe aGVHD patients. Similarly, families present in at least 15 patients and representing at least 0.5% abundance over the cohort were tested. Of the 22 families and 66 genera tested, 2 families and 10 genera had a significantly different abundance between control and severe GVHD patients. Median of relative abundance and range are indicated, and statistical analyses were performed using nonparametric Wilcoxon-Mann-Whitney test. *P < .05, **P < .01.