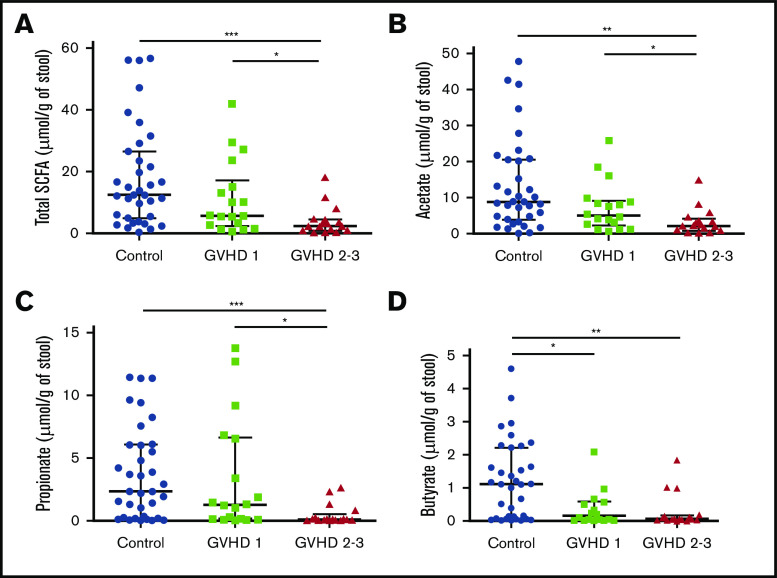
Figure 3.
SCFA profile level modifications during aGVHD. Total SCFAs (A) and acetate (B), propionate (C), and butyrate (D) fecal levels were measured and compared between controls and aGVHD patients according to severity of GVHD (SCFAs, control vs stage 2-3, P = .0003; SCFAs, stage 1 vs stage 2-3, P = .03; acetate, control vs stage 2-3, P = .002; acetate, stage 1 vs stage 2-3, P = .036; propionate, control vs stage 2-3, P = .0009; propionate, stage 1 vs stage 2-3, P = .014; butyrate, control vs stage 1, P = .021; butyrate, control vs stage 2-3, P = .001). Statistical analyses were performed using nonparametric Wilcoxon-Mann-Whitney test with false discovery rate (FDR) correction for multiple testing. Undetectable concentrations of SCFAs were observed for 2 samples and concerned only butyrate (patients with stage 2-3 GVHD). FDR *P < .05. **P < .01, ***P < .001.

