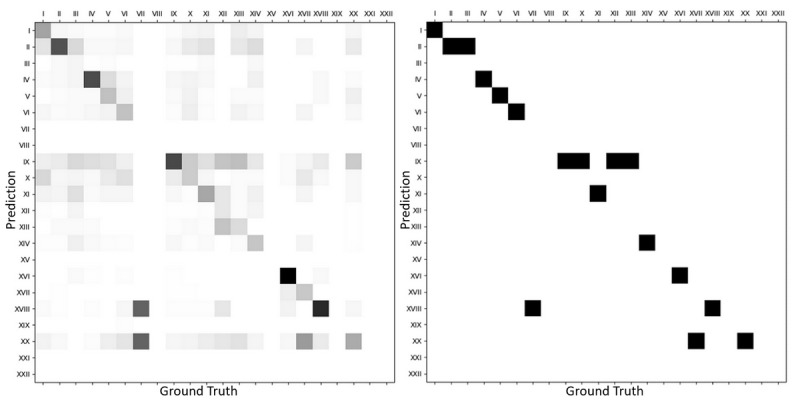
Figure 6.

The left-hand plot shows the distribution of wrong predictions per ICD-10 chapter versus their ground truth (the lighter the rarer). The right-hand plot shows the same distribution’s modes. Apparent missing values in both plots correspond to chapters either not represented in the test dataset or on which no mistakes were made. ICD-10: 10th revision of the International Statistical Classification of Diseases and Related Health Problems.
