
Figure 8.
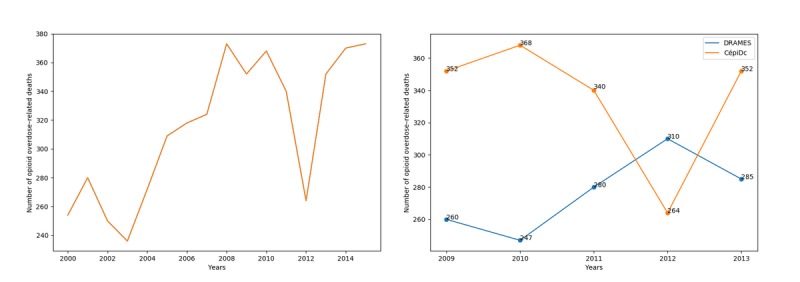
The left-hand plot shows the evolution of overdose-related deaths from 2000 to 2015 in France. The sudden decrease in 2012 appears anomalous. The right-hand plot shows the comparison with DRAMES (Décès en Relation avec l’Abus de Médicaments Et de Substances) data, a nonexhaustive, independent data source, which finds more deaths in 2012 than the exhaustive CépiDc (Centre d’épidémiologie sur les causes médicales de Décès) database.