
Figure 9.
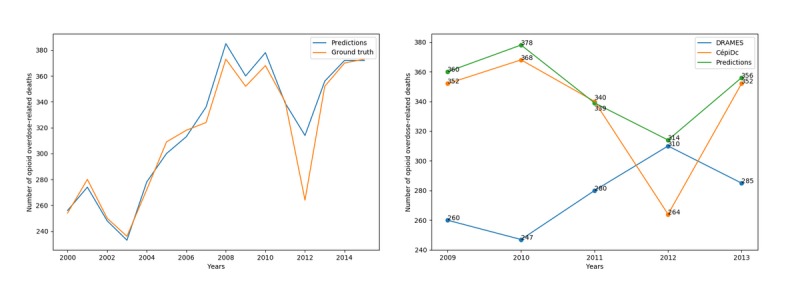
The left-hand plot shows the evolution of opioid overdose−related deaths from 2000 to 2015 in France, either coded with Iris and human coders (orange) or with the proposed approach (blue). The 2012 gap, although still present, is much smoother when using predicted underlying causes. The right-hand plot shows the comparison with DRAMES (Décès en Relation avec l’Abus de Médicaments Et de Substances) data. The contradiction with the CépiDc (Centre d’épidémiologie sur les causes médicales de Décès) database is entirely corrected with the predicted causes.