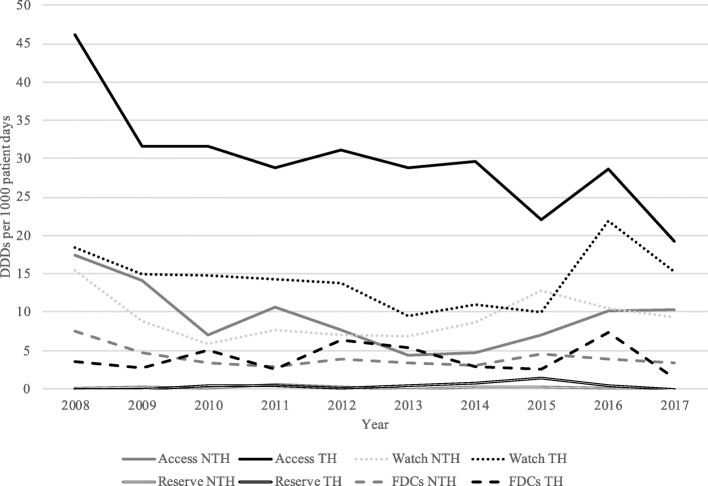
Fig. 3.
Prescribing of antibiotics categorized by access, watch, reserve and FDCs of antibiotics from 2008 to 2017. Prescribing is quantified and presented in DDDs per 1000 patients (y-axis) each year (x-axis) of the total prescribing of each antibiotic cathegory (access, watch, reserve and FDCs of antibiotics) for each hospital. Trends for each slope, indicating an overall postitive or negative trend of antibiotic prescribing (measured in DDDs per 1000 patients), over the study period are obtained by linear regression analysis and are presented together with P-values in Table 4. Abbreviations: DDD, defined daily dosis; FDC, fixed dose combinations; NTH, non-teaching hospital; TH, teaching hospital

