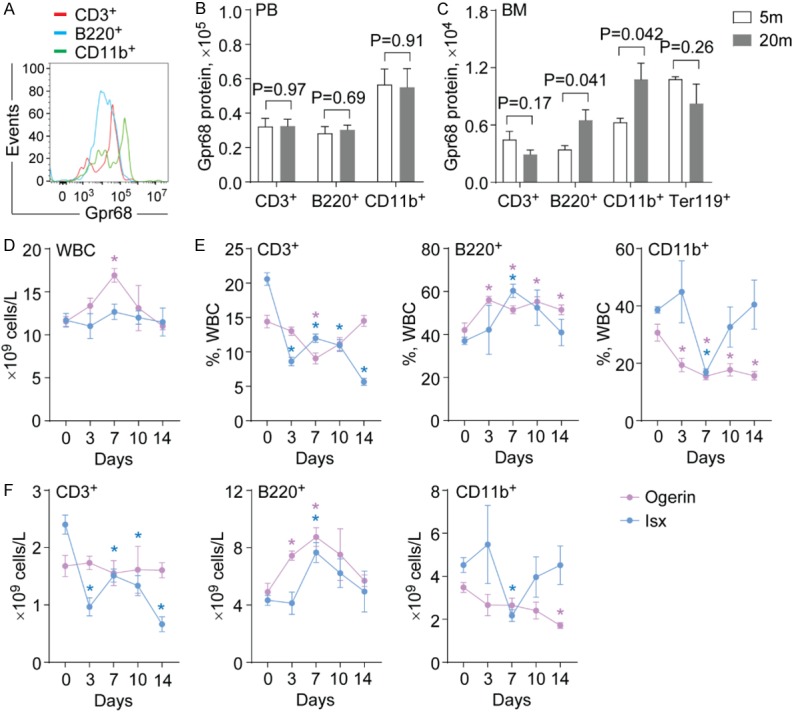
Figure 3.

The effect of Gpr68 activators on hematopoietic output. (A) Representative flow cytometric analysis of Gpr68 expression in PB cells from WT mice. (B, C) Gpr68 protein expression in PB cells (B) and BM cells (C) from WT mice at 5-month old (5 m) and 20-month old (20 m) (n=4). (D) Number of WBC in PB from WT mice after injection with Ogerin (red) or Isx (blue) at the indicated time points (n=5). (E) Frequencies of CD3+ T cells (left), B220+ B cells (middle) and CD11b+ myeloid cells (right) in PB from WT mice after injection with Ogerin (red) or Isx (blue) at the indicated time points (n=5). (F) Number of CD3+ T cells (left), B220+ B cells (middle) and CD11b+ myeloid cells (right) in PB from WT mice after injection with Ogerin (red) or Isx (blue) at the indicated time points (n=5). *, P<0.05.
