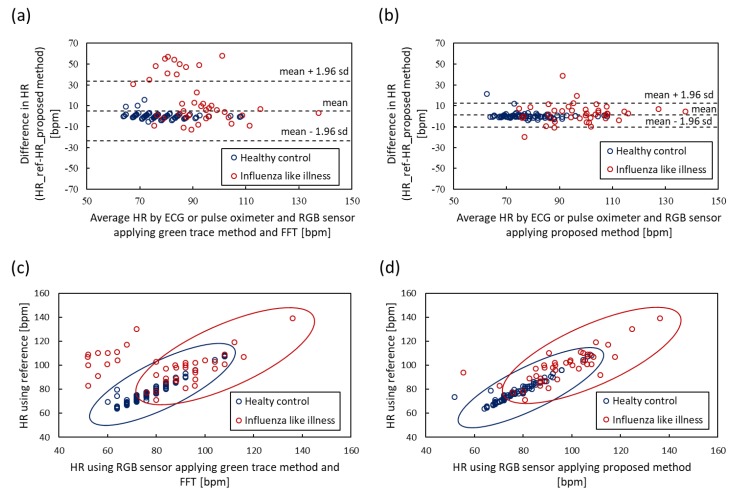
Figure 7.
Bland–Altman plots and scatter plots of heart rate (HR) obtained by RGB sensor and electrocardiogram (ECG) or pulse oximeter. (a) Bland–Altman plot of raw green trace method applying FFT. (b) Bland–Altman plot of the proposed method applying tapered window, signal reconstruction and MUSIC. (c) Scatter plot of raw green trace. (d) Scatter plot of proposed method.

