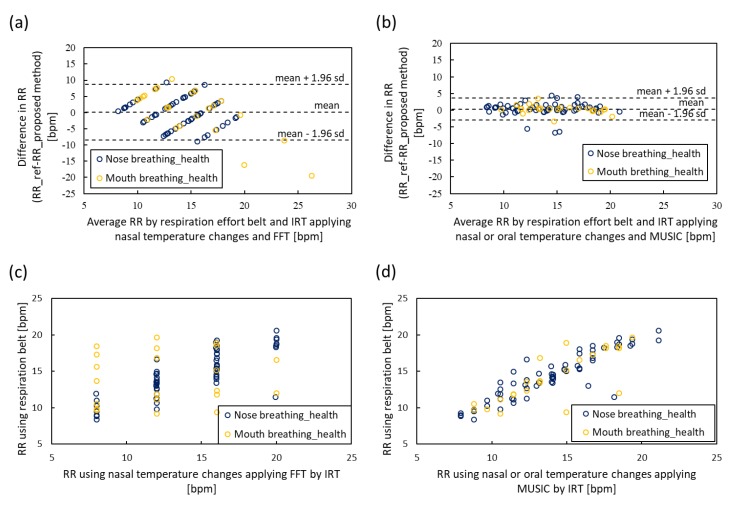
Figure 9.
Bland–Altman plots and scatter plots of RR obtained by infrared thermography (IRT) sensor and respiratory effort belt. (a) Bland–Altman plot of nasal temperature change under the application of FFT. (b) Bland–Altman plot of the proposed method applying nasal or oral signal selection using SQI and MUSIC. (c) Scatter plot of nasal temperature change under FFT application. (d) Scatter plot of the proposed method.

