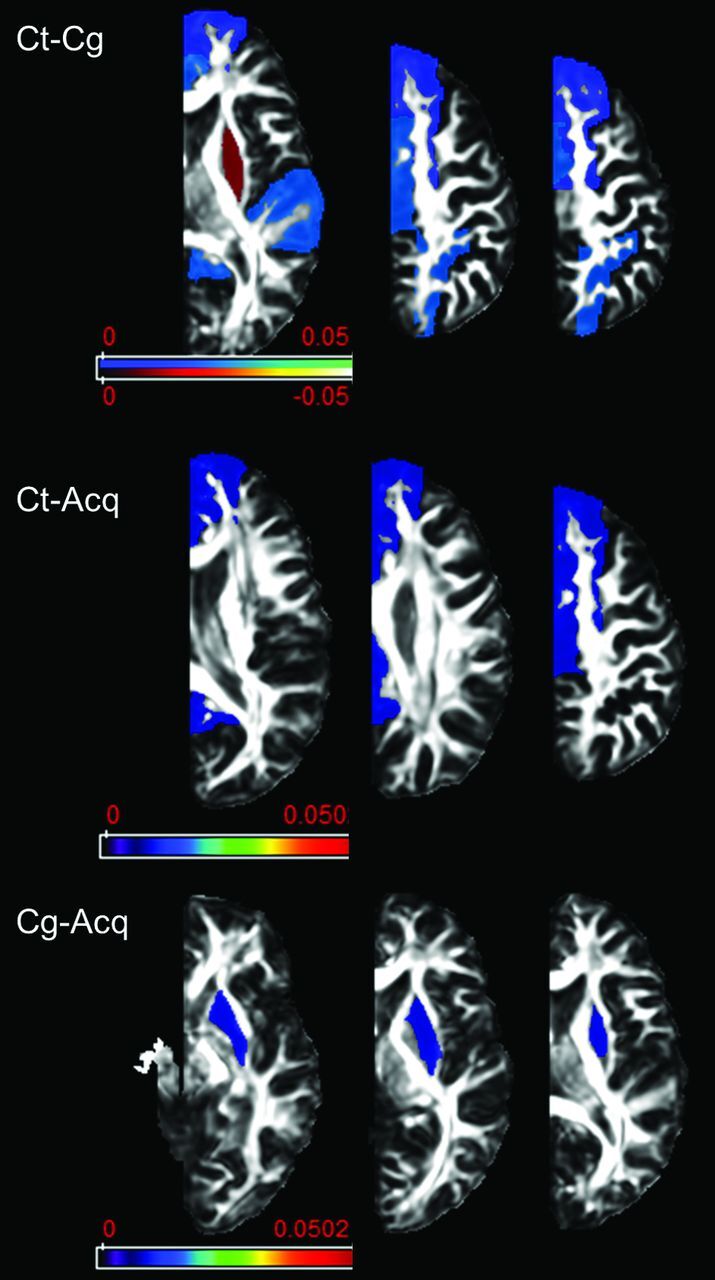
Fig 3.

Results of atlas-based analysis of GM structures. Compared with controls, patients in both etiology groups showed decreased FA in all the examined cortical areas with the exception of the putamen, which showed increased FA in the congenital group. Only results that survived the Tukey significant difference test are depicted, with P < .05. The Color bar represents the P value: blue–light blue represents PT < CT, and red–light yellow represents CT < PT. PT indicates patients including Cg (congenital) and Acq (acquired) pathologies; CT, controls..
