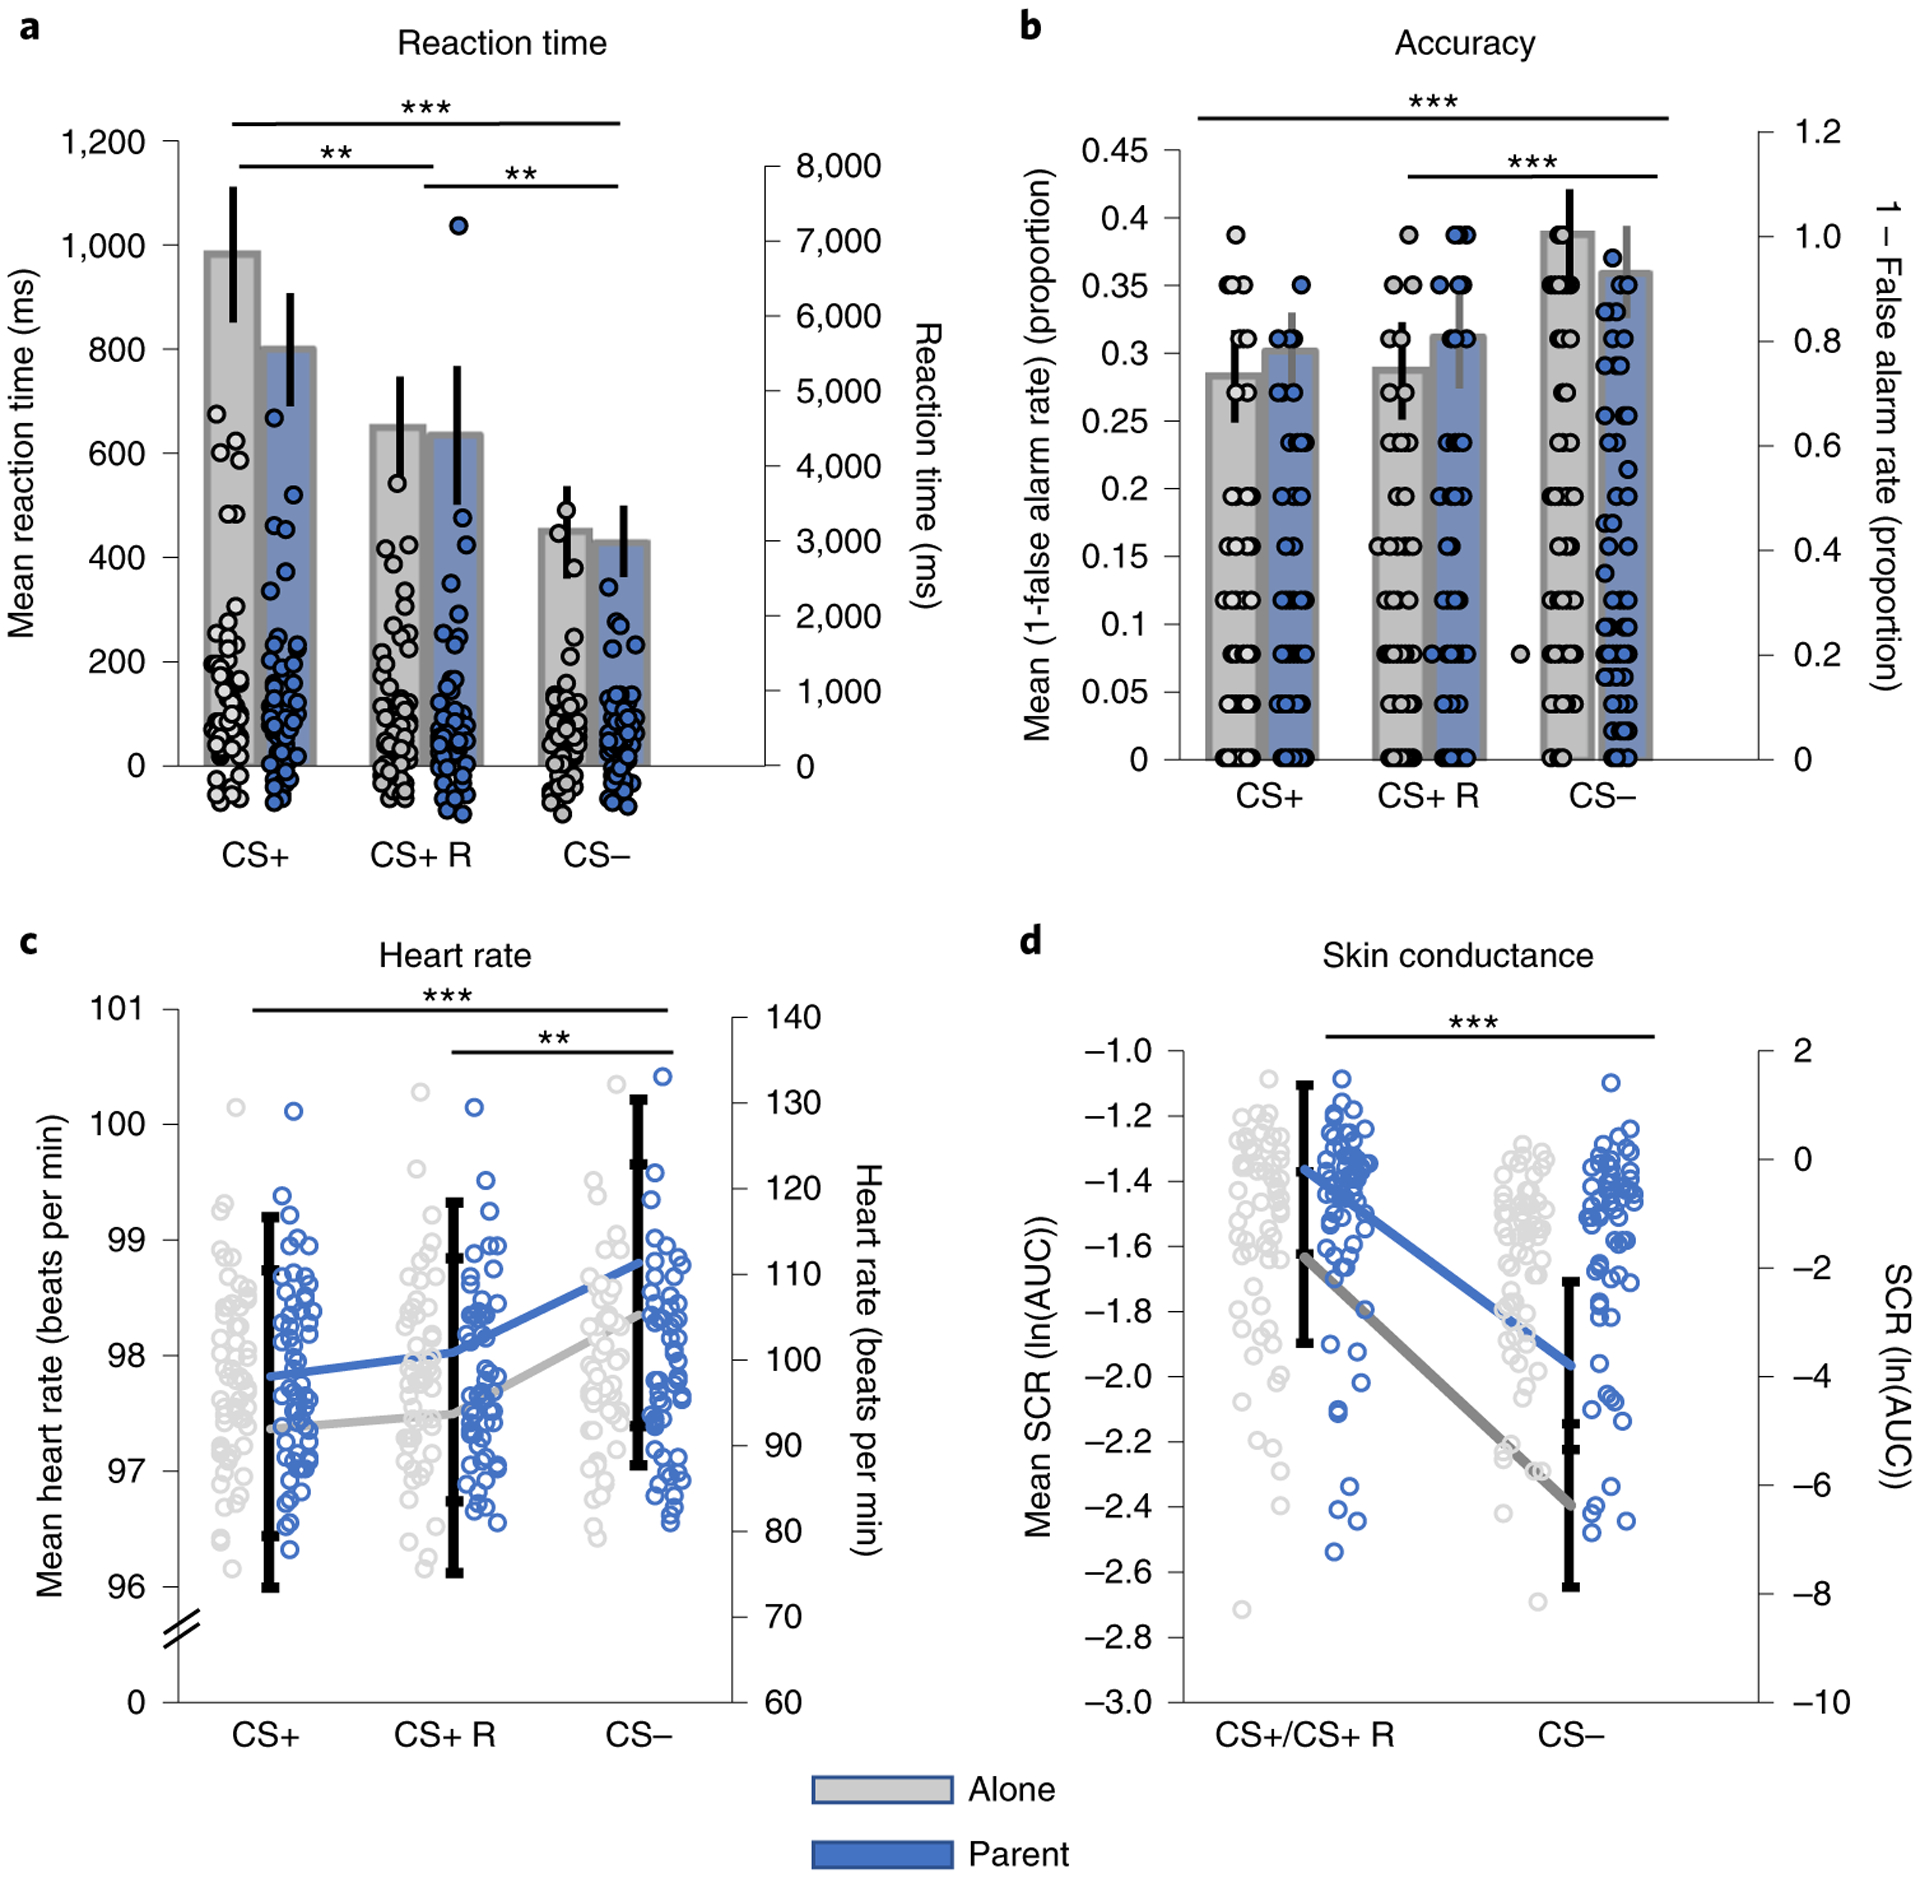
Fig. 2 |. Behavioural and physiological evidence of CS+–CS− learning.

a–d, Learning was evidenced through multiple measures. Children (n = 69) exhibited slower reaction times (a; F(1.75,125.76) = 14.94, P < 0.001, , 90% CI = 0.09, 0.28) and fewer false alarms (b; F(2,126) = 17.55, , 90% CI = 0.11, 0.31) to the CS+ relative to the CS−. Heart rate (n = 59) showed deceleration to the CS+ stimuli relative to the CS− (c; F(2,106) = 7.80, P < 0.001, , 90% CI = 0.04, 0.22), consistent with attentional deployment, and sSCR (n = 65) increased the CS+ relative to the CS− (d; F(1,59) = 53.97, P < 0.001, , 90% CI = 0.32, 0.59). CS+ R, trials of the conditioned stimulus with reinforcement present. Note that for SCR, CS+/CS+ R refers to conditioned stimuli both with and without reinforcement present. Left y axes show mean ± s.e.m. (represented by height of the bars). Because of the high variability in the mean data, individual points are represented on the right y axes, where indicated. *P < 0.05, **P < 0.01 and P < 0.001. AUC, area under the curve.
