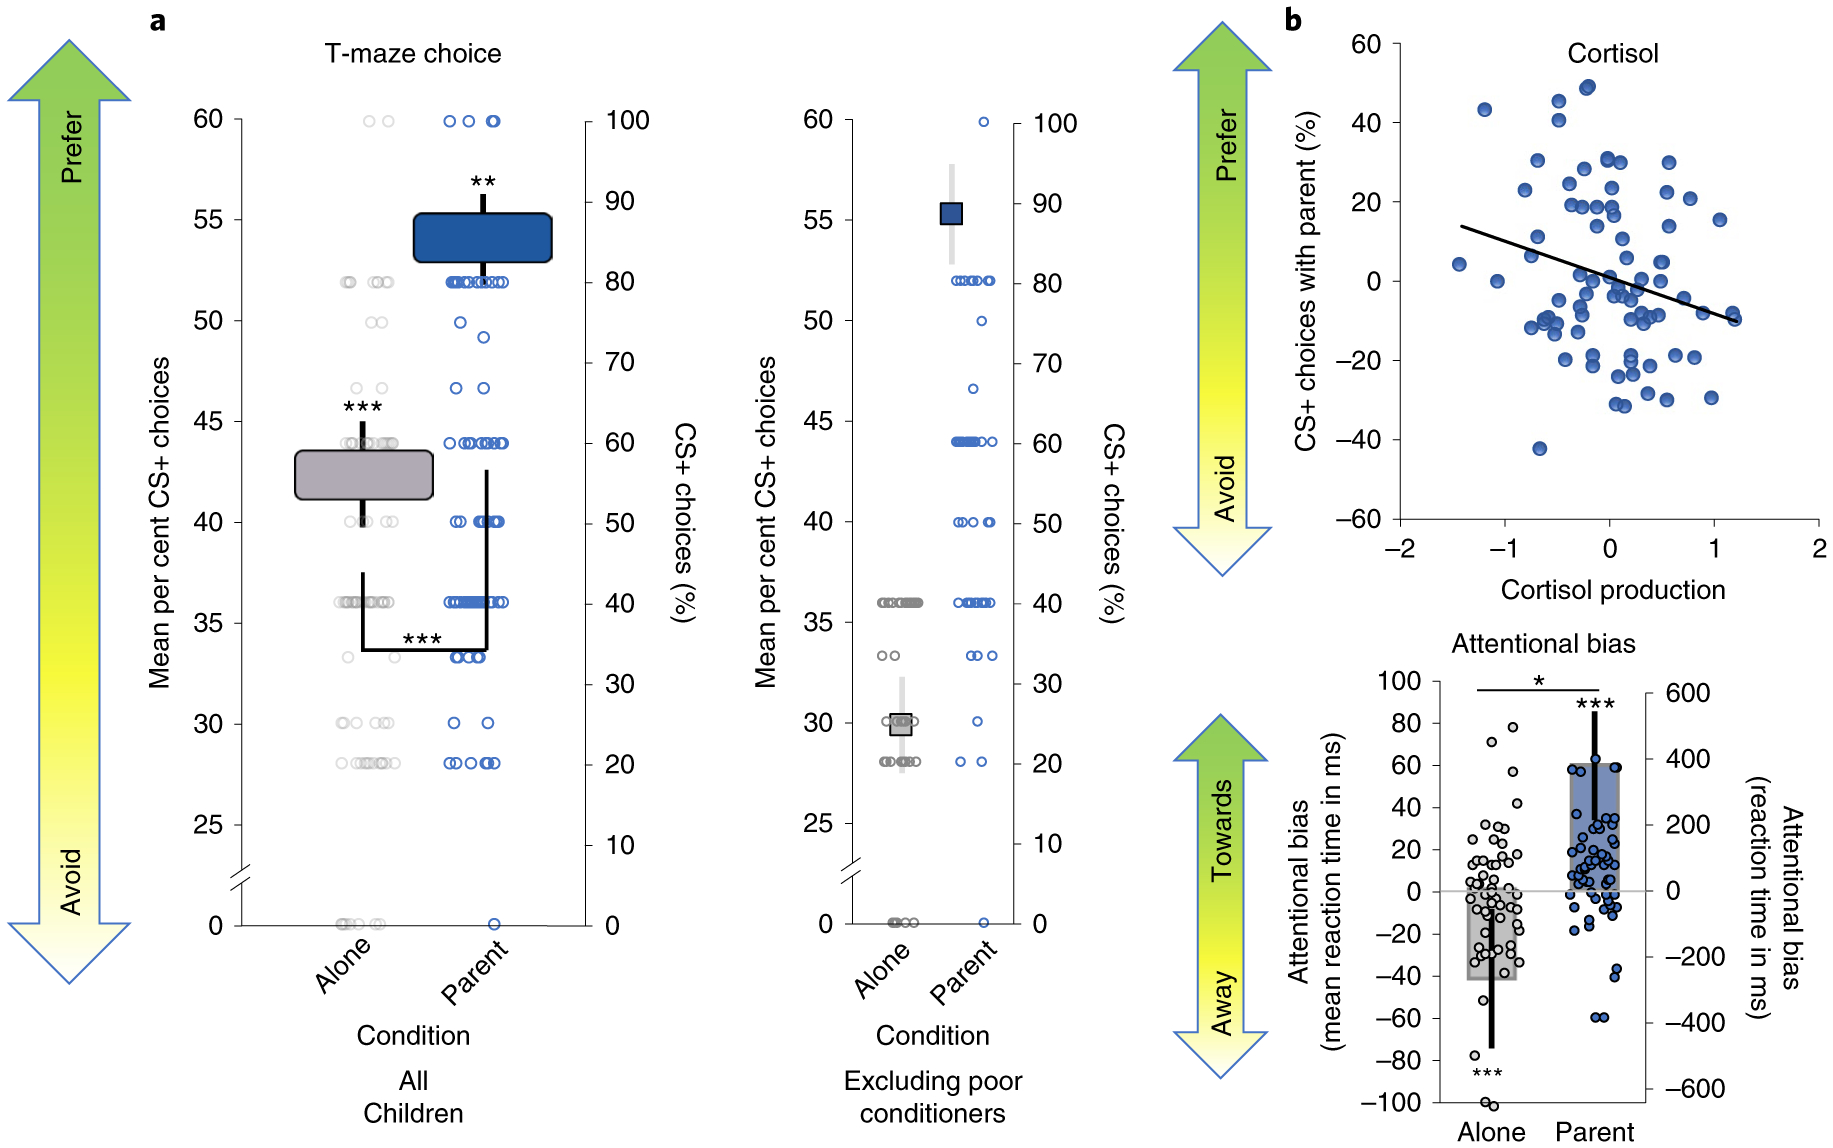
Fig. 3 |. Effect of parental presence on behavioural preference.

a, T-maze choice (n = 91). Children showed a behavioural avoidance of the CS+ when conditioned alone, but switched to a behavioural preference when conditioned with their parent present (F(1,85) = 11.80, P < 0.001, , 90% CI = 0.03, 0.23; post hoc one-sample t-test: alone condition, t(90) = −12.78, P < 0.001, Cohen’s d = 1.34, 95% CI = 1.05, 1.62; parent condition, t(90) = 2.99, P = 0.004, Cohen’s d = 0.31, 95% CI = 0.10, 0.52). Side bar shows that this preference remains when only considering children who demonstrated avoidance learning in the alone condition (that is, ‘good’ aversive conditioners) (F(1,49) = 77.51, P < 0.001, , 90% CI = 0.46, 0.70). b, Cortisol (n = 80). Parental effects on preference learning were more likely in children with lower cortisol levels and less likely in children with higher cortisol levels (β = −0.23, t(75) = −2.10, P = 0.04, R2 = 0.15, , Fchange(1,75) = 4.14, PFchange = 0.04). The x axis represents residuals for cortisol values controlling for age, sex, and percentage of CS+ choices (alone condition), hence the possibility of negative values. The y axis represents residuals for the percentage of CS+ choices (parent condition) controlling for age, sex and percentage of CS+ choices (alone condition), hence the possibility of negative values. c, Attentional bias (n = 56). Reaction time differences on the dot-probe task showed that children developed an attentional bias away from the CS+ when conditioned alone, whereas they developed an attentional bias towards the CS+ when conditioned with parental presence (F(1,50) = 5.57, P = 0.02, , 90% CI = 0.01, 0.24) (post hoc one-sample t-test on predicted values for alone: t(56) = −4.07, P < 0.001, Cohen’s d = 0.54, 95% CI = 0.27, 0.81); (post hoc one-sample t-test on predicted values for parent: t(56) = 6.92, P < 0.001, Cohen’s d = 0.92, 95% CI = 0.60, 1.22). Data are mean ± s.e.m (represented by height of the bars). Because of the high variability in preschooler’s mean data, individual points are plotted on the right y axes where indicated. *P < 0.05, **P < 0.01 and ***P < 0.001.
