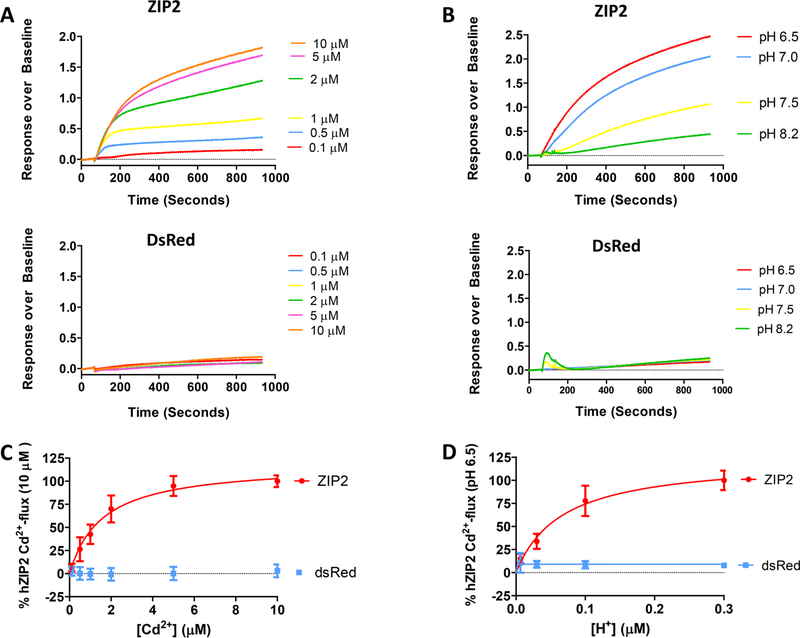
Figure 6.
Kinetics and pH dependence of the Cd2+ transport measured in ZIP2 or DsRed-Express2 (empty vector) transiently transfected HEK293 cells. Representative experiments showing the changes in fluorescence intensity of Calcium 5 dye in response to the perfusion of different Cd2+ concentrations (0.1–10 μM) at extracellular pH 6.5 (A) or at different extracellular pH values (6.5–8.2) in the presence of a saturating concentration of Cd2+ (10 μM) (B). To determine the kinetics (C) and pH dependence (D) of Cd2+ transport, the AUC for each single trace was calculated. Data from three independent experiments were normalized to the mean Cd2+ uptake by ZIP2 at pH 6.5 (337.22 ± 34 to 890 ± 22 AUC) and collected and are represented as means ± SD (n = 7–28). Kinetic parameters were obtained by fitting the data points to the Michaelis−Menten equation (solid lines).

