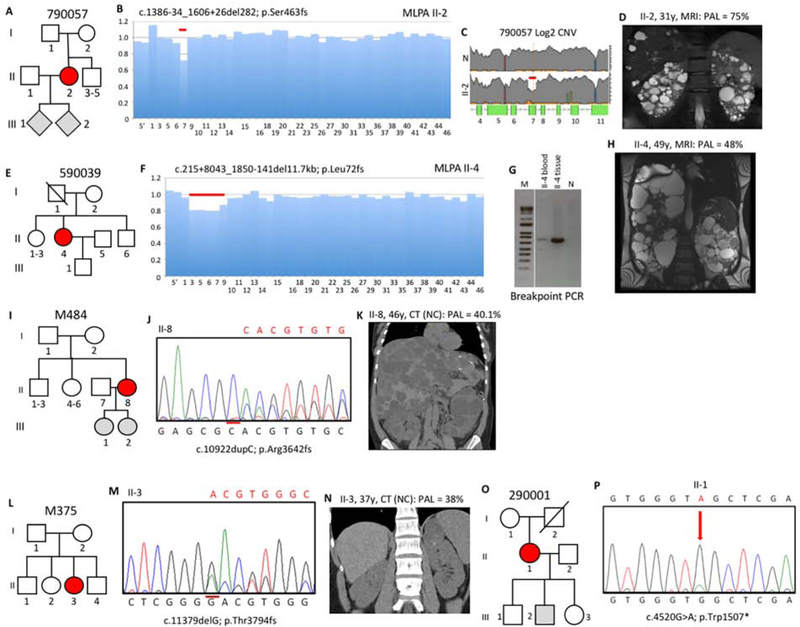
Figure 3. Pedigree, imaging and sequencing data of mosaic families not segregating the pathogenic variant.
(I). (A) Pedigree 790057 showing the mosaic mother (II-2) and her untested offspring. (B) Screening by MLPA found a possible mosaic deletion of ex7 that was confirmed by log2 copy number variant (CNV) analysis of the LR-NGS (C). (D) MRI of II-2 shows typical ADPKD at 31y. (E) Pedigree 590039 shows the mosaic subject (II-4) as the only affected. (F) A suspected mosaic PKD1 deletion was detected by MLPA and confirmed by log2 CNV analysis (Figure S2D). (G) Amplification and SS (Figure S2E) of a specific breakpoint fragment defined the deletion. (H) MRI of II-4 shows significant kidney disease at 49y (prior to ESRD) and severe PLD (after partial liver resection). (I) Pedigree M484 showing two untested daughters of the mosaic case (II-8). (J) Sanger confirmation of the mosaic single nucleotide duplication in II-8. (K) Non-contrast (NC) enhanced CT of II-8 at 46y shows significant PKD and severe PLD. (L) Pedigree M375 shows just one affected subject (II-3). (M) Sanger sequence shows II-3 is mosaic for a single nucleotide deletion. (N) CT of II-3 at 37y shows very mild kidney disease. (O) Pedigree 290001 shows the mosaic subject (II-1) and three children without PKD or untested. (P) Sanger sequence of II-1 confirms mosaicism of a nonsense change. Pedigree: red shaded, mosaic; gray, equivocal or unknown; white, ADPKD negative. The percentage of the observed versus the expected level of the PAL is indicated next to each radiological image.

