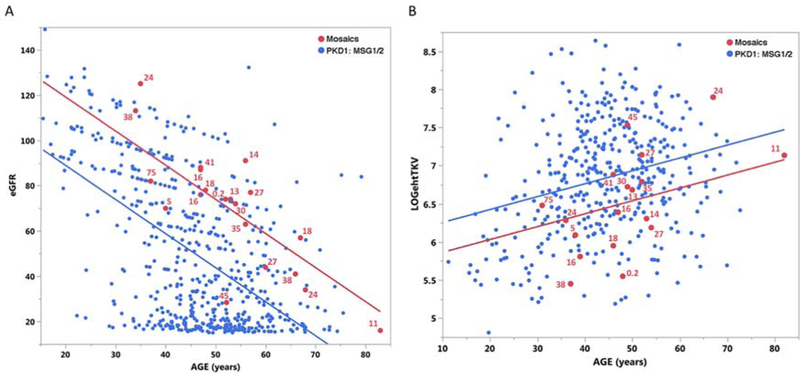
Figure 6. Regression comparison of eGFR and htTKV in mosaic subjects compared to PKD1 controls.
The control populations (blue) are PKD1 patients with truncating (MSG1) or strongly predicted non-truncating changes (MSG2)9 from a MTPC cohort without known mosaicism; n=550 for eGFR and 403 for htTKV. The mosaic population is indicated in red and the percentage level of the mosaic allele compared to a fully penetrant allele is listed for each case. (A) The renal function analysis shows that the mosaic population (red) has a significantly higher eGFR than the controls (blue). (B) Analysis of renal structure shows that the mosaic population has a significantly lower htTKV than the controls. The htTKV is plotted on a log2 scale. No correlation was observed between the level of mosaicism and disease severity (eGFR or htTKV).

