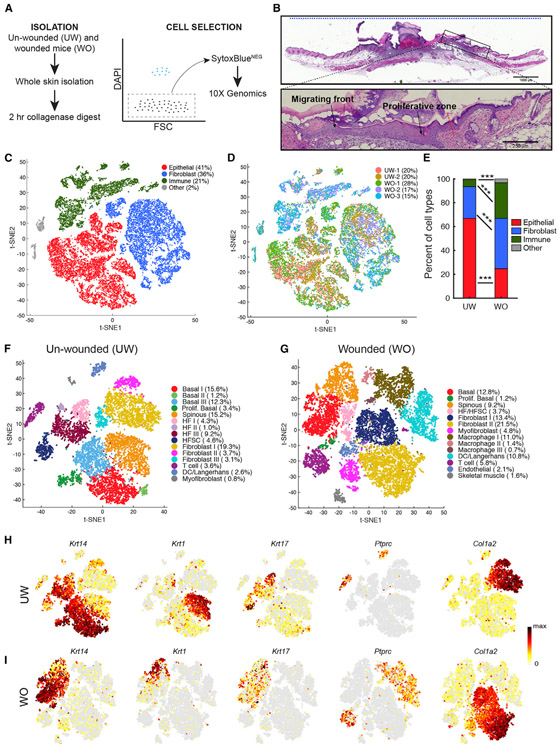
Figure 1. scRNA-Seq Analysis of All Cells in the UW and WO Skin.
(A) Schematic diagram detailing the single-cell isolation and live-cell selection strategy.
(B) H&E analysis of WO skin showing a region equivalent to those used for scRNA-Seq. The blue dashed line at the top indicates a representative 10-mm region used for single-cell suspension. Enlarged image of the boxed area in top panel is shown at the bottom to highlight the wound migrating front and proliferative zone. Red dashed line points to the wound margin.
(C) t-Distributed Stochastic Neighbor Embedding (tSNE) plot for all five samples with the major cell type populations highlighted, and their relevant percentage per total number (26,779) of all cells indicated in parenthesis. The two small clusters in gray (labeled as “other”) are endothelial cells and skeletal muscle cells (see Figure S1C).
(D) Cells are colored by replicate identity in the tSNE plot.
(E) Bar graph representing major cell type populations. Chi-square test was used to determine the statistical significance of differences in the relative proportion of each cell type between UW and WO samples. ***p < 0.0005.
(F) tSNE plot for the two aggregated UW replicate datasets. The percentage of cells present in each cluster per total number (10,615) of cells under analysis is indicated. Markers associated with the indicated cell types are listed in Figure S2B and Table S1A.
(G) tSNE plot for the three aggregated WO replicate datasets (total 16,164 cells). Markers associated with the indicated cell types are listed in Figure S2C and Table S1B.
(H) Feature plots showing expression of the indicated genes in the UW replicates in (F). Normalized expression levels for each cell are color-coded and overlaid onto the t-SNE plot.
(I) Feature plots in the WO replicates in (G).

