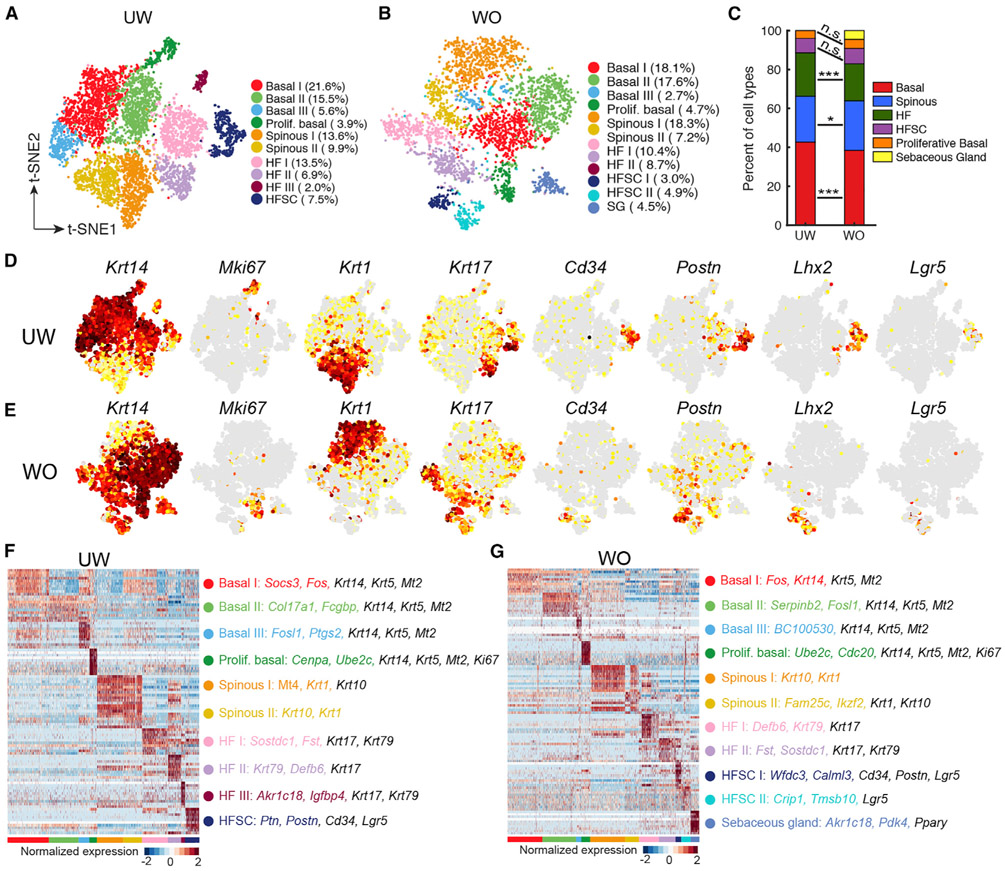
Figure 2. scRNA-Seq Analysis Reveals Mild Changes in Epithelial Cellular Makeup during Wound Healing.
(A) tSNE plot for all epithelial cells from UW skin with cell each type indicated. The percentage of cells in each cluster per total number (7,099) of cells under analysis is indicated in parenthesis.
(B) tSNE plot for all epithelial cells (4,021) from WO skin.
(C) Bar graph representing the major epithelial cell type populations in the UW and WO samples. Chi-square test was performed (*p < 0.05; ***p < 0.0005).
(D) Feature plots highlighting the expression of key genes in UW epithelial cells.
(E) Feature plots highlighting the expression of key genes in WO epithelial cells.
(F) Heatmap for the top 10 genes enriched in each cluster from the UW skin. Top two marker genes for each cluster are colored to match cluster identity, and additional genes used in the final annotations are colored in black. All marker genes are listed in Table S3A.
(G) Heatmap for the top 10 genes enriched in each cluster from the WO skin. All marker genes are listed in Table S3B.

