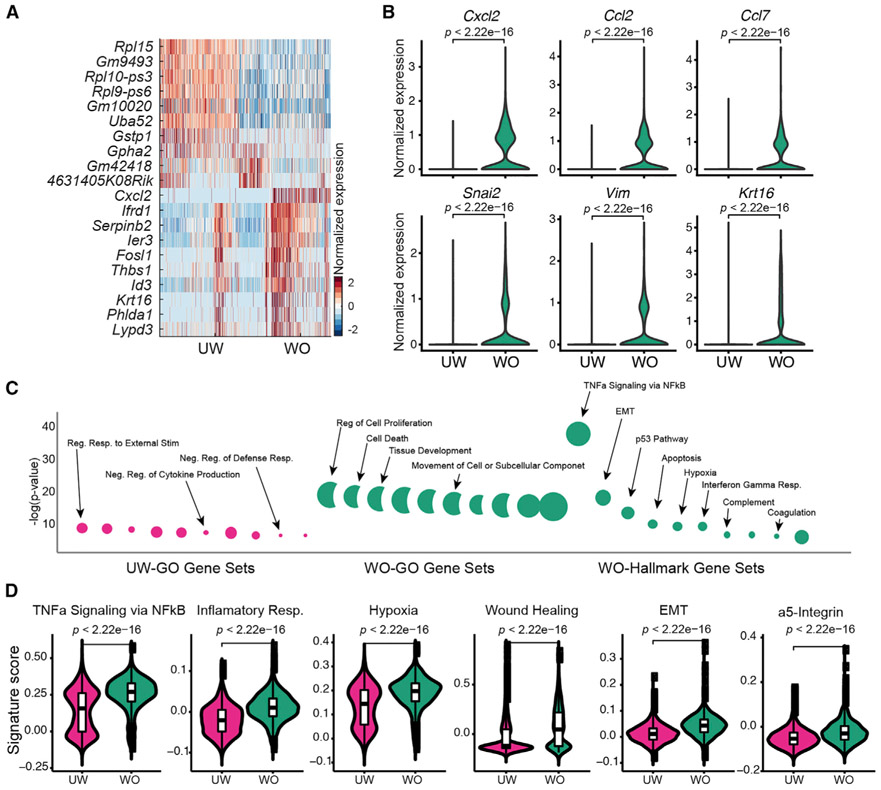
Figure 3. Gene Expression Differences between Epidermal Basal Cells of the UW and WO Skin.
(A) Heatmap showing the top 10 markers for basal cells from the UW and WO samples. All the identified markers are listed in Table S4.
(B) Expression of select genes in UW and WO basal cells. p values are from two-sided Wilcoxon rank-sum tests.
(C) GO analysis of the identified markers (listed in Table S4) of UW and WO basal cells using GO (left) and Hallmark (right; defined by fewer genes) gene sets.
(D) Gene scoring analysis using the indicated molecular signatures. p values are from two-sided Wilcoxon rank-sum tests.

