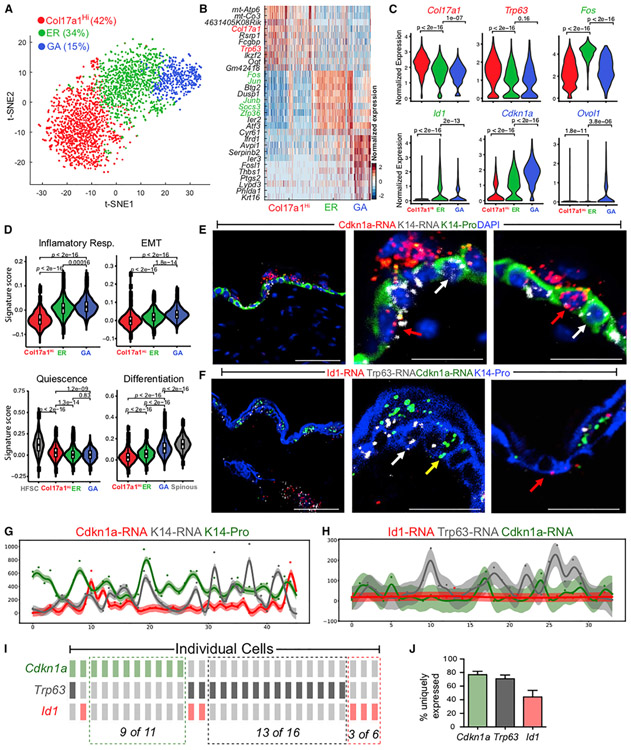
Figure 4. scRNA-Seq and RNAScope Data Revealing Heterogeneity within UW Epidermal Basal Cells.
(A) tSNE plot for NP basal cells from two UW replicates. The percentage of each subpopulation per total number (2,838) of basal cells was indicated.
(B) Heatmap of top 10 markers for each subcluster in (A). Genes used to annotate cell identity are indicated by the corresponding colors. A complete list of marker genes is provided in Table S5.
(C) Violin plots showing expression of key marker genes. p values are from two-sided Wilcoxon rank-sum tests.
(D) Gene scoring analysis using the indicated molecular signatures. HFSCs and spinous cells from the UW sample were used as positive controls. p values are from two-sided Wilcoxon rank-sum tests.
(E) RNAScope data showing spatial distribution of Cdkn1a and Krt14 transcripts and K14 protein in UW skin. Shown are both low (left)- and high (middle, right)-magnification images. Red and white arrows indicate Cdkn1a+ and Cdkn1a− basal cells, respectively. DAPI stains the nuclei. Scale bars: 50 μm in low-magnification image; 10 μm in high-magnification images.
(F) Spatial distribution of Cdkn1a, Trp63, and Id1 transcripts and K14 protein in UW skin. Red, white, and yellow arrows indicate Id1+, Trp63+, and Cdkn1a+ basal cells, respectively. Scale bars represent the same as in (E).
(G) Quantification of fluorescence intensity (represented by a color-coded dot) for Cdkn1a and Krt14 transcripts and K14 protein in each individual cell from a representative section. The curve represents a Gaussian process regression (GPR), and a 95% confidence interval is shown as shaded area.
(H) Quantification of fluorescence intensity for Cdkn1a, Trp63, and Id1 transcripts and K14 protein in each individual cell from a representative section.
(I) OncoPrint representation of Cdkn1a, Trp63, and Id1 expression in individual cells where a rectangle represents an individual cell. A color-coded rectangle indicates high expression of the corresponding marker gene. The cells are sorted based on the onor off state of the markers to show mutually exclusive expression pattern.
(J) Bar graph showing percentage of cells that exclusively express Cdkn1a, Trp63, or Id1 per total number of cells that express the particular gene (n = 3 replicates). Error bars represent mean ± SEM.

