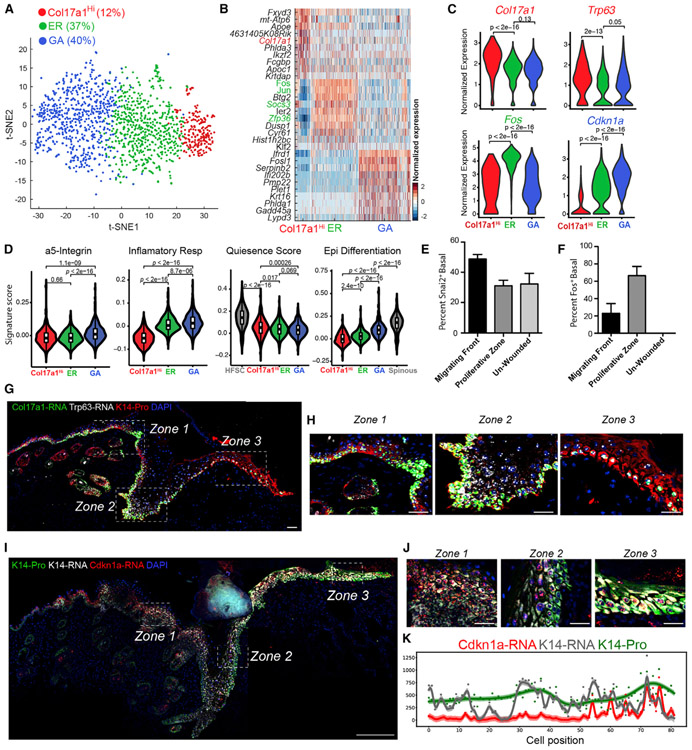
Figure 5. Basal Cell Heterogeneity in WO Skin.
(A) tSNE plot for NP basal cells from two WO replicates. WO-2 was not included in this analysis given its low basal cell number. The percentage of each subpopulation per total number (1,555) of basal cells was indicated.
(B) Heatmap of top 10 markers for each subcluster. A complete list of marker genes is provided in Table S6.
(C) Violin plots showing expression of key marker genes. p values are from two-sided Wilcoxon rank-sum tests.
(D) Gene scoring analysis using the indicated molecular signatures. p values are from two-sided Wilcoxon rank-sum tests.
(E) Quantitative analysis of immunofluorescence data for Snai2 protein. Percent Snai2+ cells in the basal layer of different regions in WO skin is shown here, and representative images are shown in Figure S6F.
(F) Quantitative analysis of immunofluorescence data for Fos protein. Percent Fos+ cells in the basal layer of different regions in WO skin is shown here and representative images are shown in Figure S6G.
(G) RNAScope data showing spatial distribution of Col17a1 and Trp63 transcripts and K14 protein in WO skin. DAPI stains the nuclei. Scale bar: 50 μm.
(H) Enlarged images of the boxed areas in (G). Zones 1–3 correspond to regions that are distal from the wound (zone 1), hyperproliferative (zone 2), and in migrating front (zone 3). Scale bar: 50 μm.
(I) RNAScope data showing spatial distribution of Cdkn1a and Krt14 transcripts and K14 protein in WO skin. DAPI stains the nuclei. Scale bar: 50 μm.
(J) Enlarged images of the boxed areas in (I). See legends for (H) for zone definition. Scale bar: 50 μm.
(K) Quantification of fluorescence intensity for Cdkn1a and Krt14 transcripts and K14 protein in each individual cell from a representative WO skin section. The curve represents a GPR, and a 95% confidence interval is shown as shaded area.

