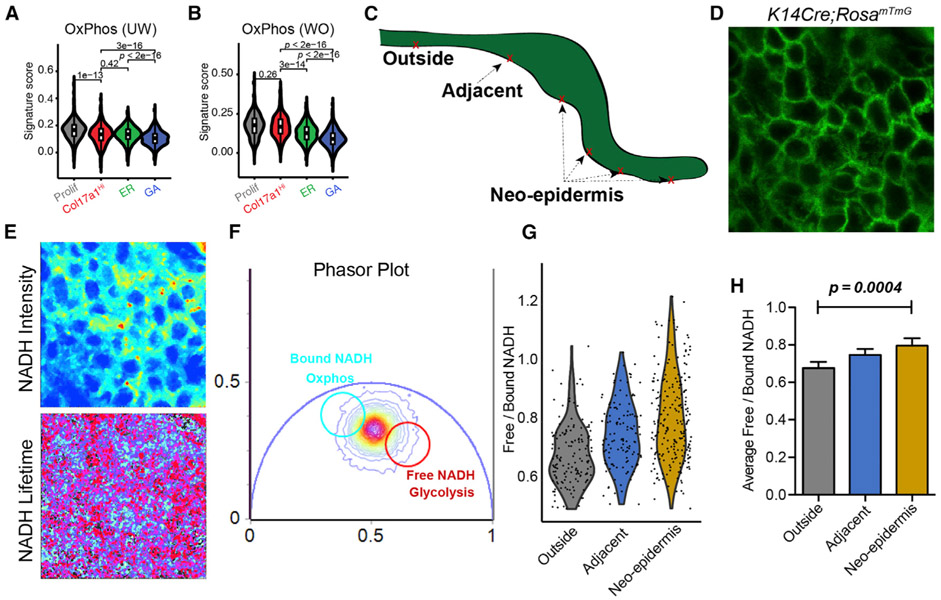
Figure 6. FLIM Data Validating scRNA-Seq-Predicted Metabolic Heterogeneity in WO Skin.
(A) Gene scoring analysis of all four UW basal subclusters using an oxidative phosphorylation signature. p values are from two-sided Wilcoxon rank-sum tests.
(B) Gene scoring analysis of all four WO basal subclusters. p values are from two-sided Wilcoxon rank-sum tests.
(C) Sketch diagram of wound epithelium showing the areas probed with FLIM.
(D) A representative image of wound epidermal cells indicated by GFP expression.
(E) Representative images of NADH signal and NADH lifetime signals.
(F) A representative phasor plot with cell phasor fingerprint, which is a representation of the fluorescence lifetime decay of all cells in the region of interest (ROI) after fast Fourier transformation.
(G) Violin plot incorporating all cells and their corresponding free/bound NADH ratios from four biological replicates (156 cells from the outside region, 127 cells from the adjacent region, and 231 cells from the neo-epidermis).
(H) Quantification of average free/bound NADH ratios from multiple cells from the four biological replicates of various regions of the wound. For statistical analysis we used an unpaired two-tailed Student’s t test. Error bars represent mean ± SEM.

