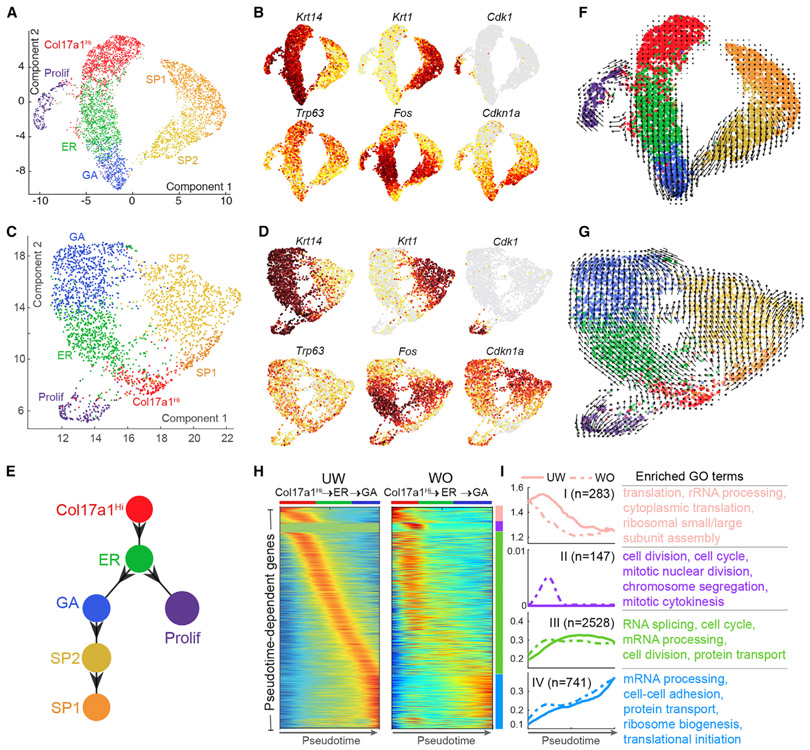
Figure 7. Pseudotemporal Dynamics Analysis of Interfollicular Epidermal Cells in UW and WO Skin.
(A) UMAP dimensional reduction of all UW epidermal cells. Cells are colored by the annotated identity.
(B) Feature plots of (A) for the indicated genes. Cells are colored by the normalized expression, with dark red indicating the highest expression.
(C) UMAP of all WO epidermal cells.
(D) Feature plots of (C) for the indicated genes.
(E) scEpath-predicted lineage differentiation diagram.
(F) Projection of non-linear RNA velocity fields onto the UMAP space in (A).
(G) Projection of non-linear RNA velocity fields onto the UMAP space in (C).
(H) Pseudotemporal dynamics of the 3,699 UW pseudotime-dependent genes along the Col17a1Hi-to-GA path in UW and WO samples. Each row (i.e., gene) is normalized to its peak value along the pseudotime. Distinct stages during pseudotime are represented by colored bars on the side. Cell identity is indicated on the top of each heatmap generated by the smoothed, normalized gene expression.
(I) Average expression patterns (left) and enriched biological processes (right) of the four gene clusters along pseudotime in (H). Solid and dashed lines indicate the average expression of a particular gene cluster in UW and WO samples, respectively. The number of genes in each gene cluster is indicated in parenthesis, and the enriched GO terms in each gene cluster are listed.

