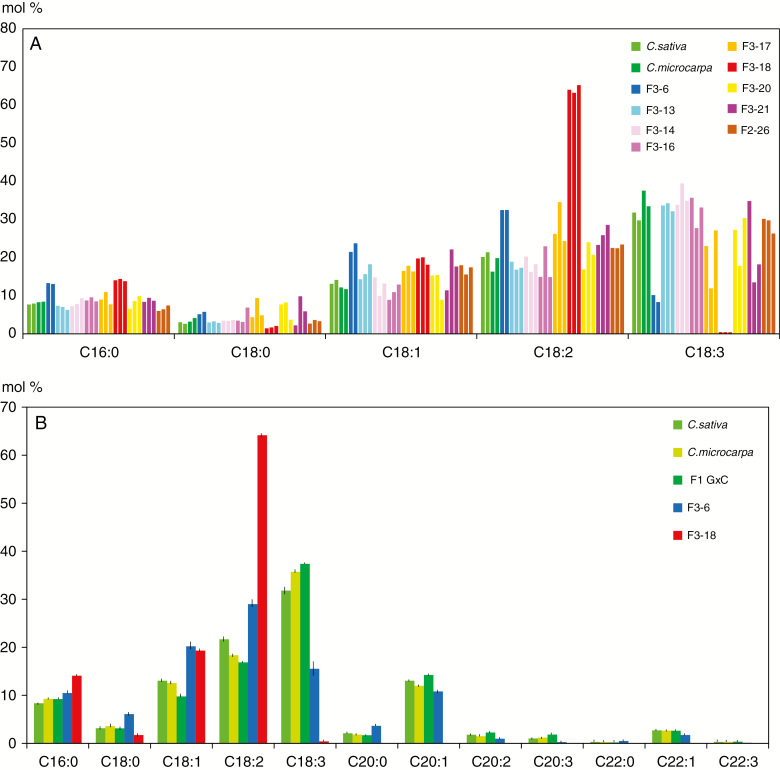
Fig. 6.
Relative fatty acid profiles of F2 and F3 hybrid seeds. (A) Major fatty acid profile of individual seeds of nine F3 populations and controls was analysed by GC–MS. For each population, two or three seeds were analysed. Each bar represents a single seed. (B) Mean values (± s.e.m.) obtained with a greater number of individual seeds. F1 G×C = F2 seeds produced by the cross C. microcarpa × C. sativa. For all samples n = 9, except F1 G×C (n = 4) and F3-18 (n = 3).

