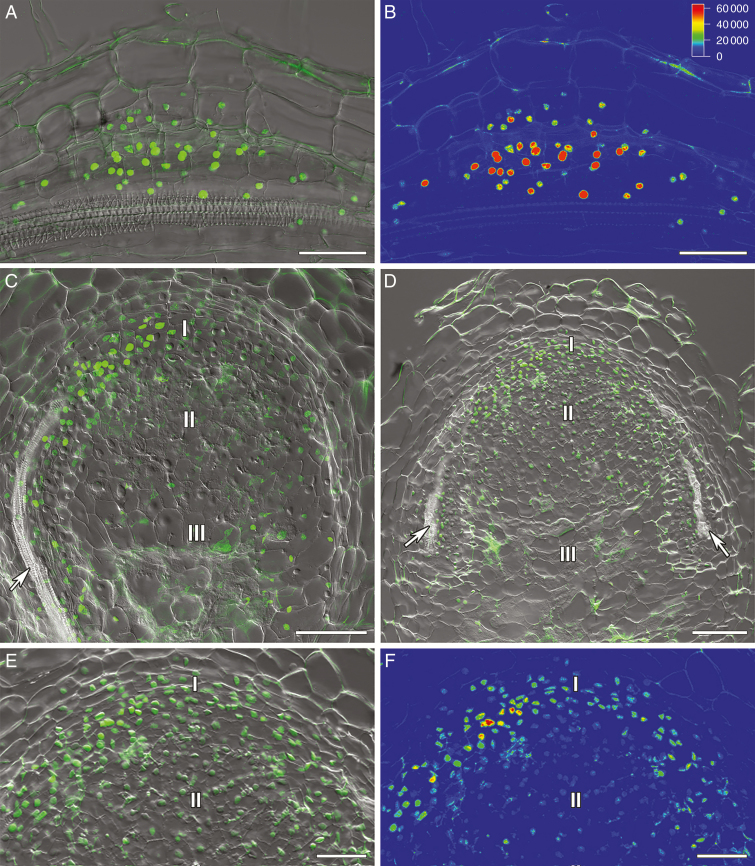
Fig. 1.
Visualization of auxin response maxima in the nodule primordia and nodules of composite SGE pea wild-type plants containing the DR5::GFP-NLS construct. (A, B) Nodule primordium. (C) Two-week-old nodule. (D–F) Three-week-old nodules: (D) general view; (E, F) meristem. (A, C, D, E) Merge of differential interference contrast and green channel used for the GFP-NLS signal in green. (B, F) The heatmap shows colour-coded fluorescence signal intensities for the green signal channel; the quantification scale is the same for B and F images. I, meristem zone; II, infection zone; III, nitrogen fixation zone; arrows indicate vascular bundles. Scale bars are 50 µm (A, B, E, F) and 100 µm (C, D).

