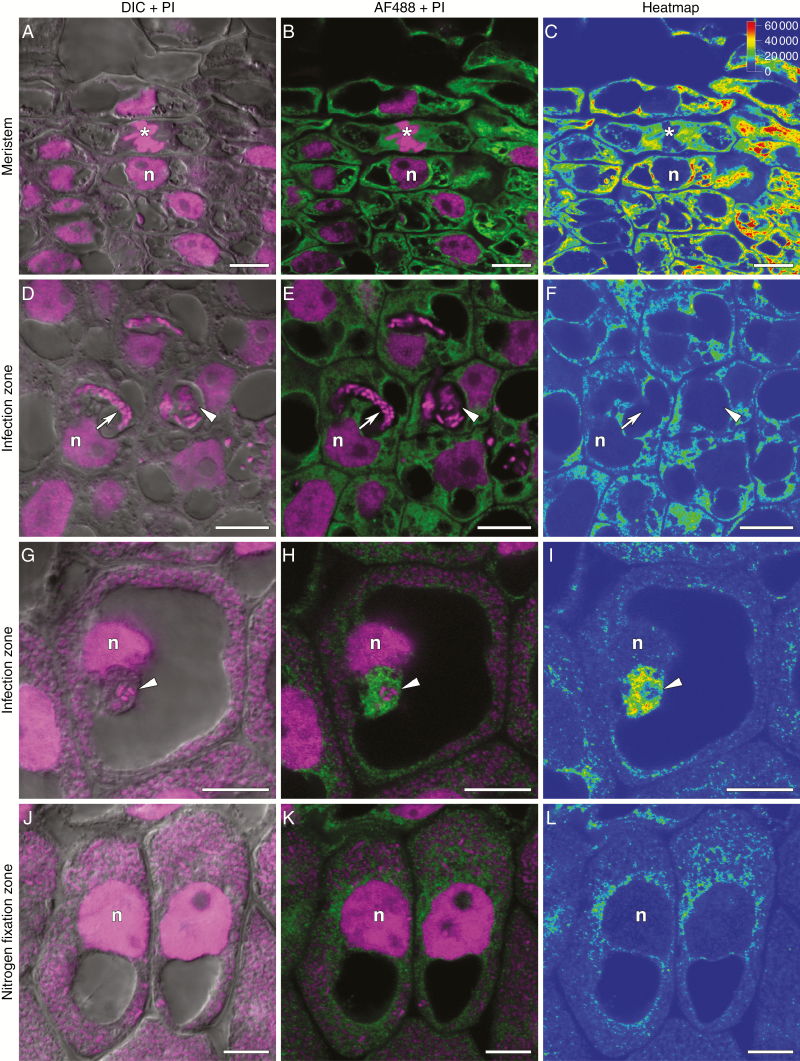
Fig. 5.
Immunolocalization of trans-zeatin riboside in the 2-week-old nodules of pea SGE wild type. (A–C) Meristem. (D–F) Cells from the early infection zone. (G–I) Cells from the late infection zone. (J–L) Cells from the nitrogen fixation zone. (A, D, G, J) Merge of differential interference contrast (DIC) and magenta channel. (B, E, H, K) Merge of green and magenta channels. A single optical section is presented: trans-zeatin riboside in green and DNA (bacteria and nuclei) in magenta. (C, F, I, L) The heatmap shows colour-coded fluorescence signal intensities for the green signal channel; the quantification scale is the same for all images. PI, propidium iodide; AF488, Alexa Fluor 488. n, nucleus; *, mitosis; arrows indicate infection threads; arrowheads indicate infection droplets. Scale bars are 10 µm.

